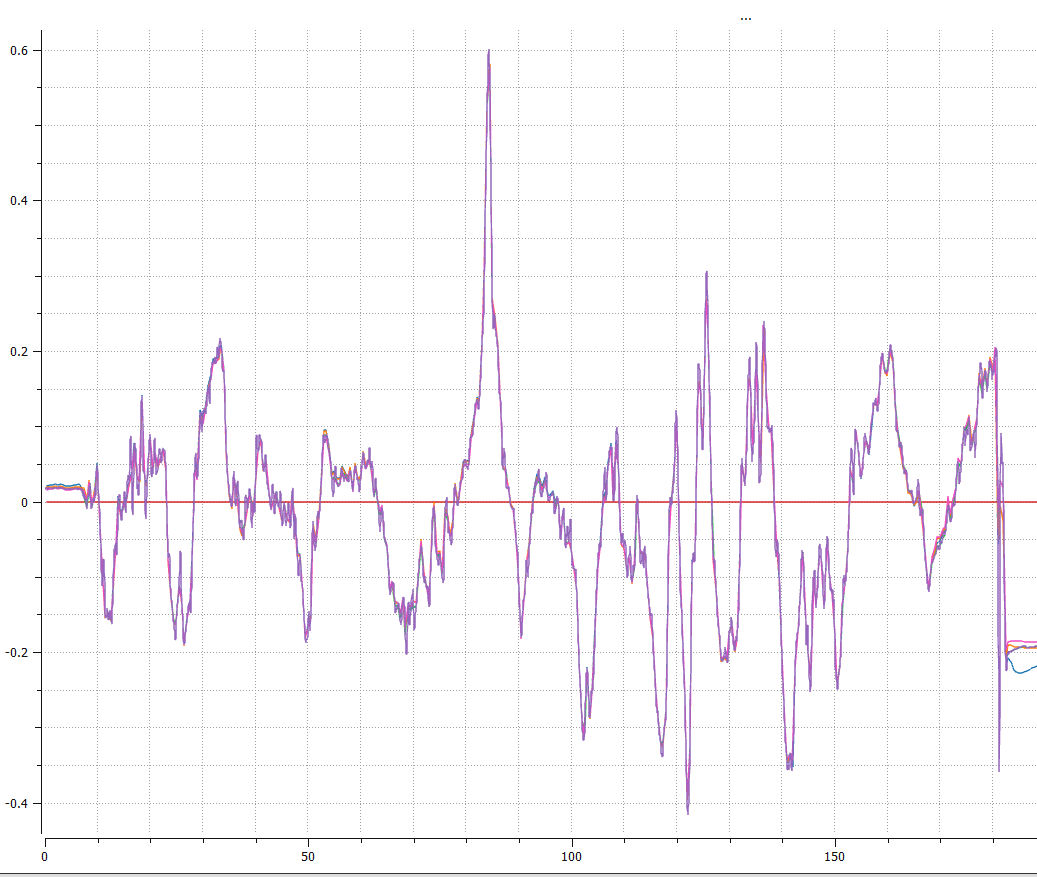
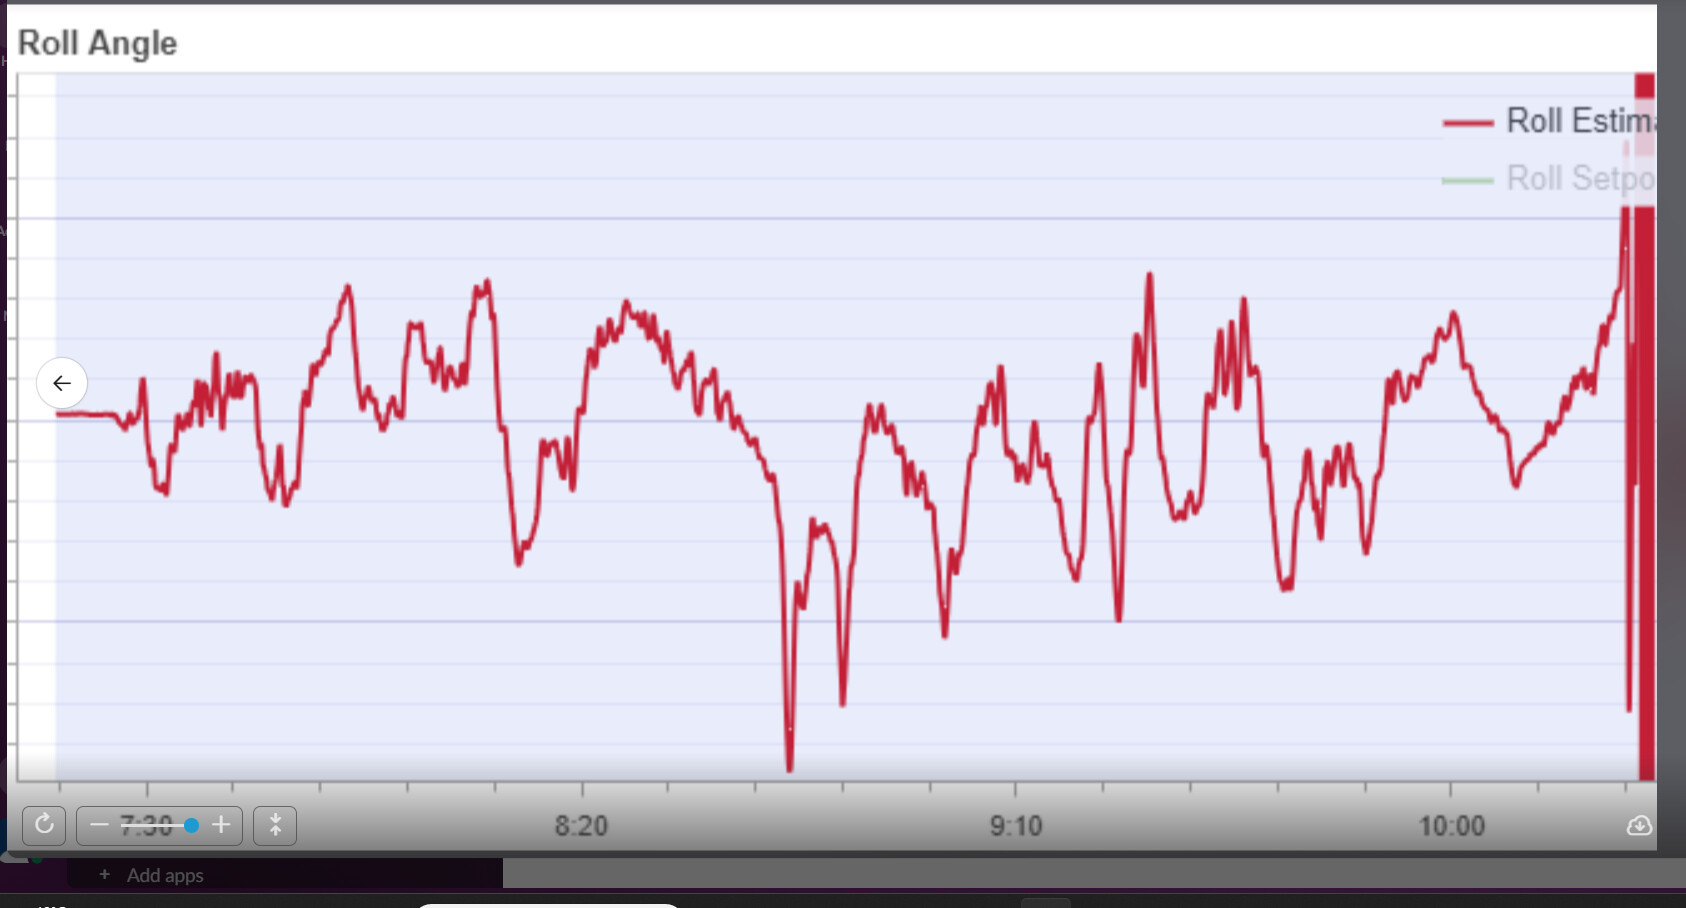
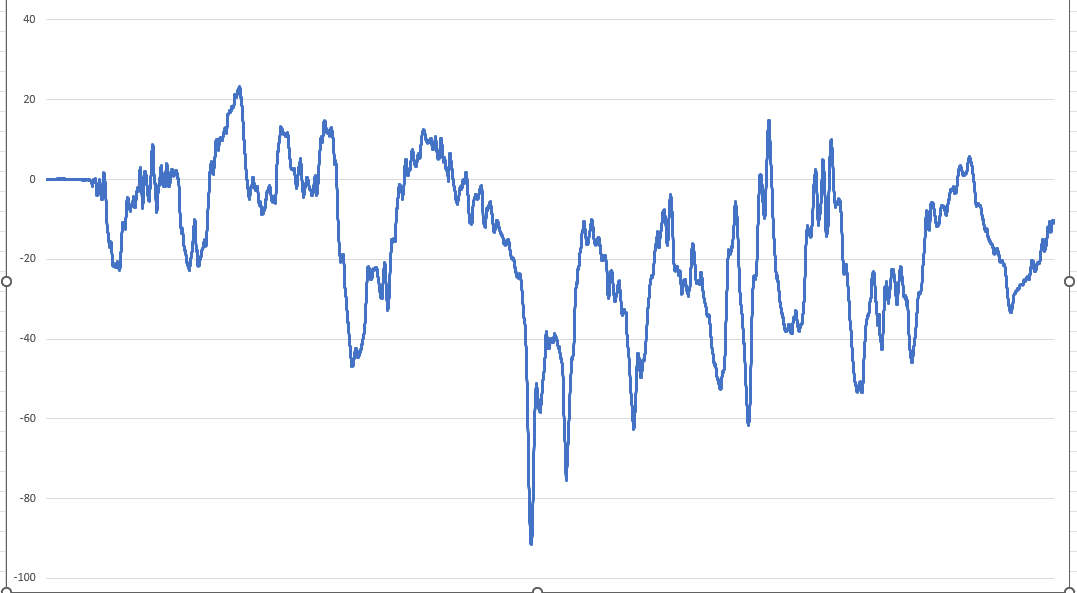
I ran into something strange when analyzing a log file from my px4 equipped fixed wing drone. Hardware vers PX4_FMU_V5 (V540) sw vers 1c8ab2a0. The graphs below show the roll angle as displayed by logs.px4.io and then by PlotJuggler. The graps are identical “most of the time” but from approx 45 to 90 seconds into the Plotjuggler graph it looks like one of them is inverted and offset by some value. (I hope the grahs are visible). Does anybody have an idea what is going on?
That’s interesting. Could you share the link to logs.px4.io, so I can have a look.
I’m also copying in @bkueng.
Thanks for your reply. Here is the log file: 3D View - Flight Review
Hm, what are you plotting in plotjuggler?
This is “estimator_attitude.00/q,01” The three “estimator_attitude.xx” and “vehicle_attitude/q.01” look identical
q,01 would be a quaternion and hence different. You need to convert to Euler angles, see here: feature request: yaw_degrees for imu quaternion · Issue #238 · facontidavide/PlotJuggler · GitHub
Yes it depends on the quaternion to angle conversion you use in plotjuggler.
Yes, indeed. De-quaternying did the trick. Thanks!