Hello Everyone !
We’re Tilak.io, a small engineering services company that focuses on drone development, and we’ve been working on a log analysis tool that we recently open sourced.
We wanted to share it with the PX4 Community.
The goal was to add what we’ve been missing from the different plot method we’ve been trying:
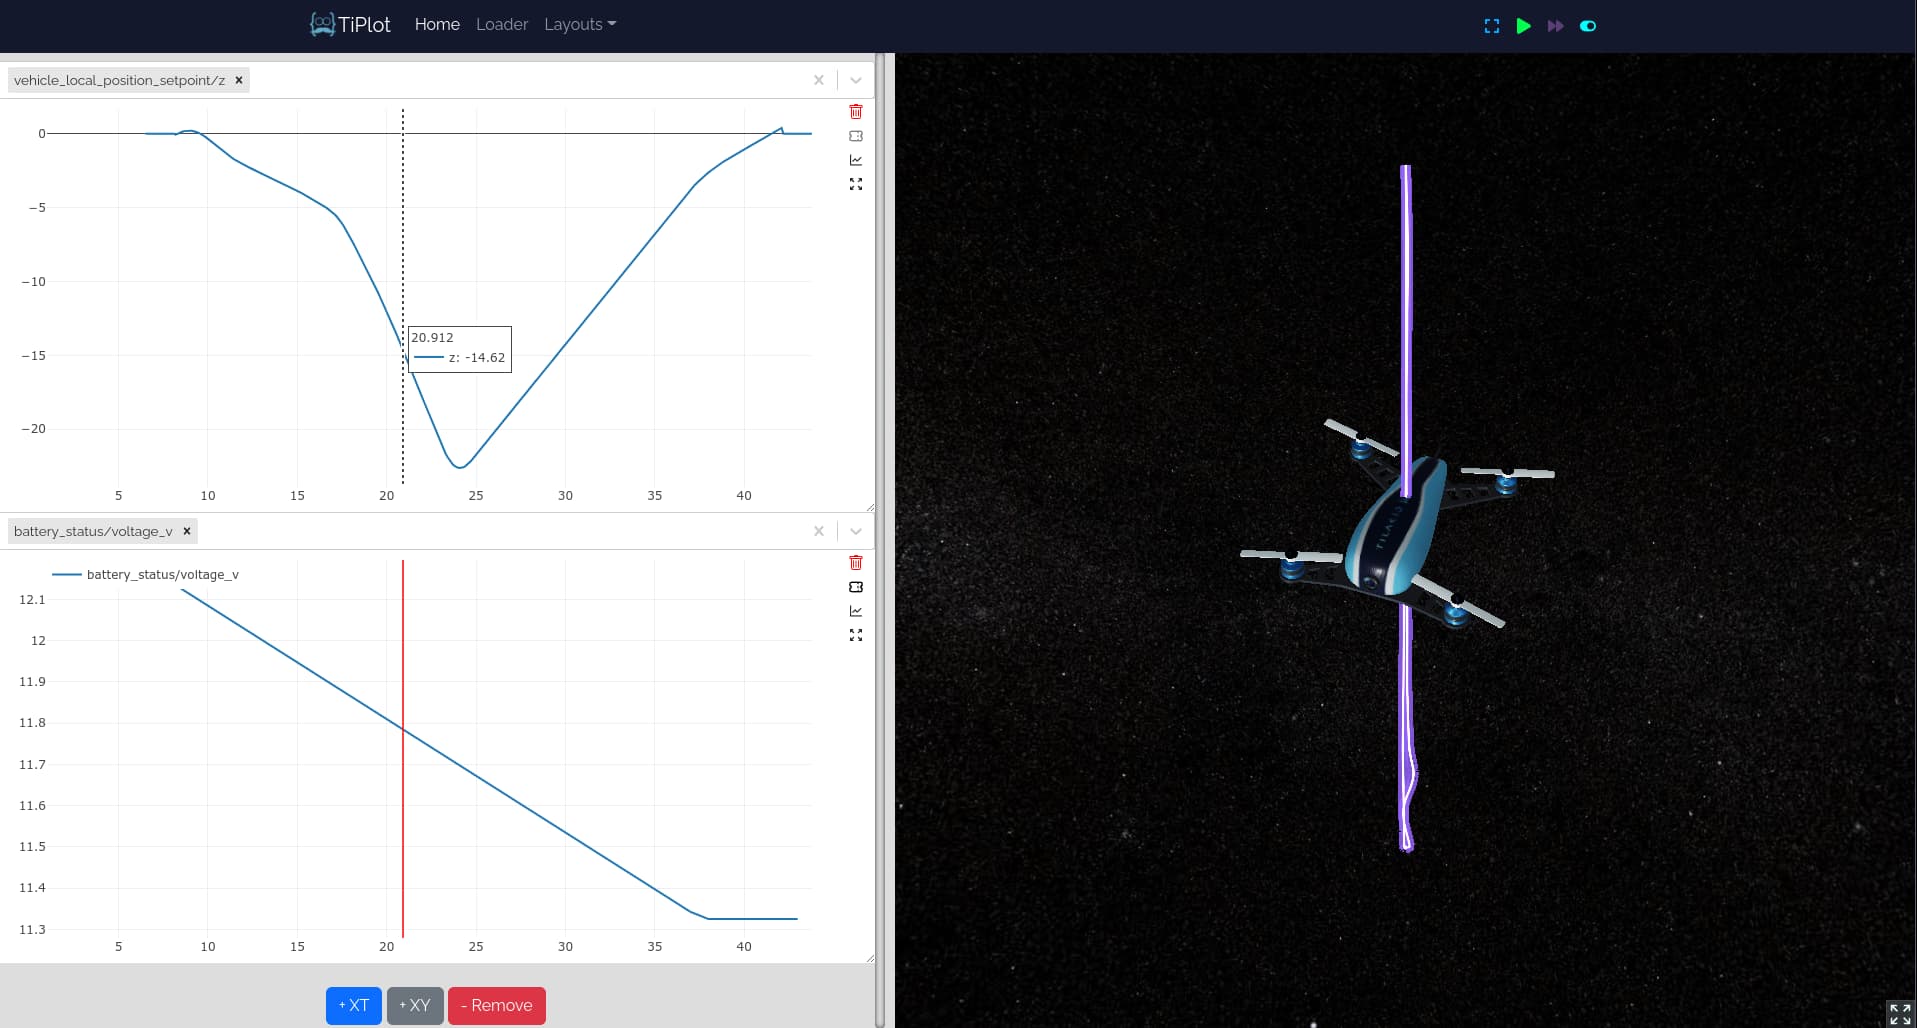
- All plots are synchronized on timestamp
- Interactive 3d view
- Field selection via a dropdown menu with auto-complete
- Cursor displaying the current value
- Simple and intuitive zooming
- Multiple parsers (ULG, CSV, + Generic methods to implement new ones)
- Sent data from a Jupyter notebook or any python code to plot anything !
- Compatible with Linux and Windows
## TiPlot GitHub repo. ##
## Download TiPlot AppImage ##
We’ll be happy to have your feedback, and we’re always available to develop new features for you !
Thanks,
Pierre.
email:
pierre@tilak.io
4 Likes
Hi!
It’s look good.
But I tried to see my log ULG. I looked on this:
more than one hour and nothing happed.
Hi Artem,
First of all, many thanks for trying out !
Have you tried any XT or XY plots ?
The 3d view relies on vehicle_global_position, maybe it’s not present in your log ?
Oh, I see.
It work!
But I think it will spend much time to tune all plots for my needs.
It will be nice if you give for new user some default layouts.
And why 3d view relies only on v_g_p? it will be nice to see 3d view relied on v_NED_position.
You’ll be able to create your own layout once and save it + reuse it.
Good idea though to have generic layout for general analysis, but they tend to be really specific to a use case.
For the 3d plot, we’re thinking of implementing a configuration file where we can define parsers parameters, that could be a place.
If you happen to have custom things you’re willing to visualize (3d or 2d) you’d better off sending your data from python or a jupyter notebook, this way you can define what is used for the 3d plot (entity) and apply any process to your data.
See here: GitHub - tilak-io/tiplot: a cool and simple visualising tool to analyse your drone flights.
Again, thanks for your feedback and taking the time to give our tool a go :-).

Thanks!
Maybe later I’ll try it.