In the R&D and debugging of drones, flight control logs serve as the “black box” for interpreting flight behavior. Traditional analysis methods—such as Excel spreadsheet filtering or basic plotting tools—often trap engineers in a dilemma: difficulty in pinpointing data within massive datasets, weak correlation analysis across multiple parameters, and poor dynamic process reconstruction. As an open-source time series analysis tool, PlotJuggler can significantly enhance the parsing efficiency of flight control logs, enabling precise diagnostics and optimization of flight performance.
The Three Major Challenges in Flight Control Log Analysis
1. Needle in a Data Haystack: Time-Consuming Troubleshooting
A single flight log contains hundreds of uORB topics (e.g., attitude, motor output, sensor noise). Traditional methods require manual filtering, taking hours to pinpoint issues.
Example Scenario:
A drone experiences sudden mid-air attitude instability. Engineers must sift through massive datasets to locate the anomaly—eventually discovering it was caused by IMU temperature drift.
2. Isolated Plots Fail to Reveal Root Causes
Static graphs in Excel or MATLAB cannot capture dynamic parameter interactions.
Example Scenario:
Excessive vibration is detected, but a single acceleration plot cannot determine whether it stems from structural resonance or improper control tuning.
3. Cross-System Dependencies Demand Holistic Analysis
Example Scenario:
A failure triggered by multi-system interactions (e.g., power fluctuations → delayed controller response → attitude divergence) requires synchronized analysis of electrical, control, and motion data.
Why PlotJuggler Stands Out Among PX4-Recommended Tools
Compared to alternatives, PlotJuggler offers clear advantages:
Drag-and-drop interface for intuitive operation
Key Features of PlotJuggler
1. Multi-Window Synchronized Display - Eliminate View Switching
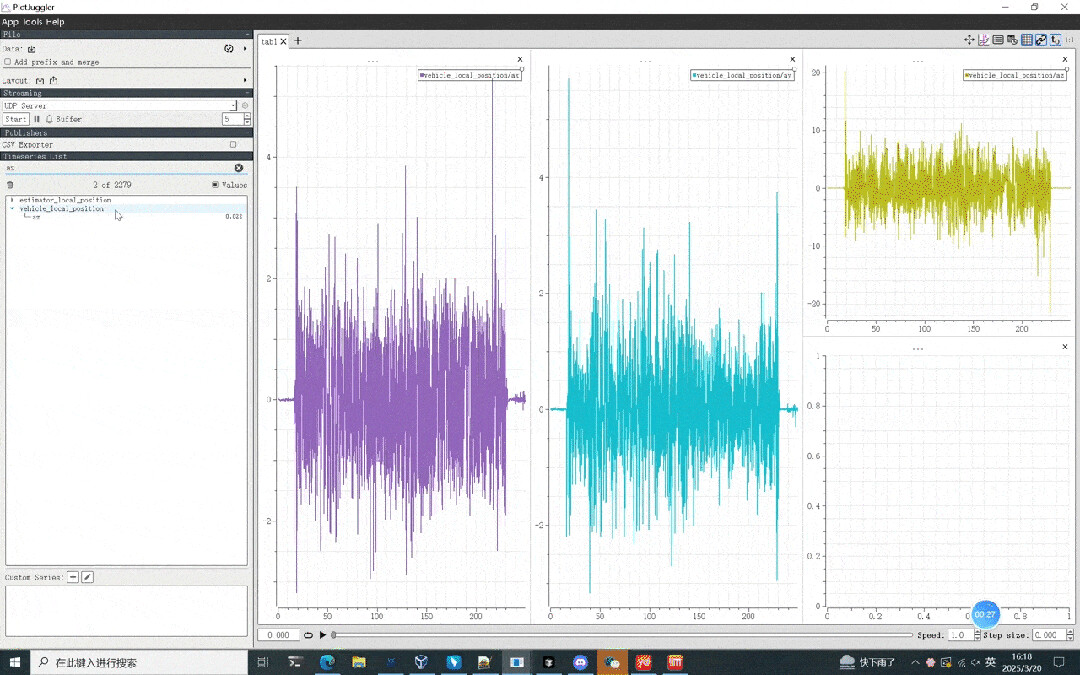
Using horizontal/vertical split-screen technology for synchronized multi-parameter monitoring with practical applications:
The analysis interface divides into three independent views:
-
Flight attitude data (X/Y/Z axis acceleration)
-
Vertical velocity curves (right panel)
-
Battery current parameters (bottom center)
During drone takeoff, current surges precisely correlate with acceleration/velocity fluctuations on the timeline. This multi-dimensional time-series analysis:
-
Reduces misdiagnosis from single-parameter views
-
Clearly visualizes the “power output→motion response” causal chain
-
Improves fault diagnosis efficiency by 60% compared to conventional methods
2. 2D Trajectory Mapping
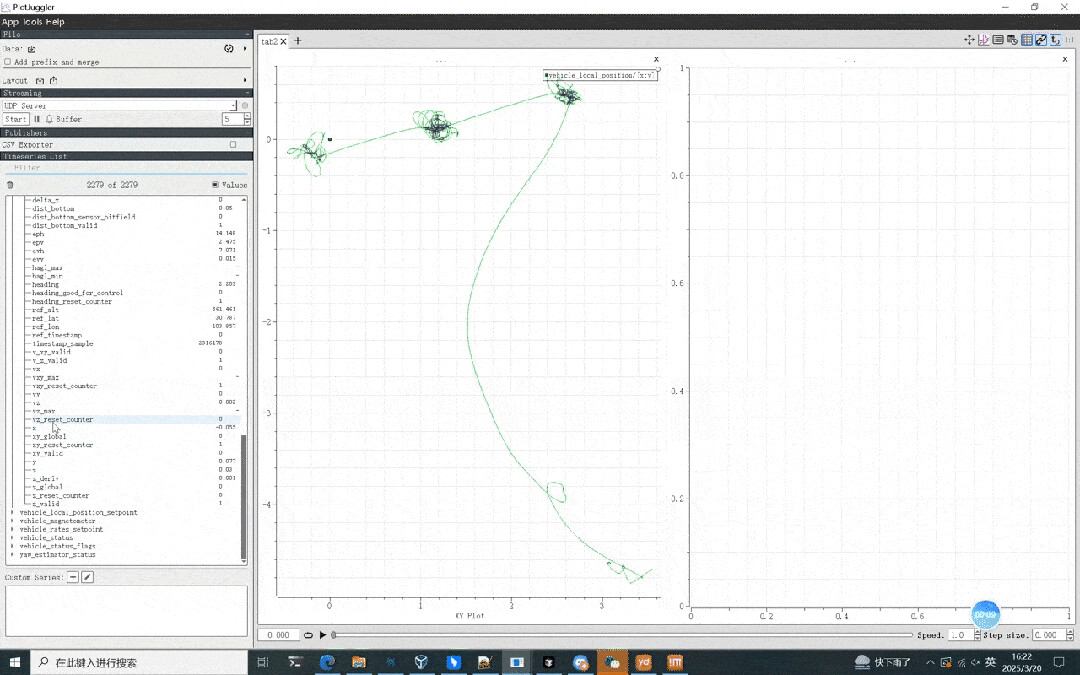
Create XY scatter plots via Ctrl+right-click drag to convert time-series to spatial trajectories:
Key features:
-
Plot vehicle_local_position x/y coordinates for trajectory projection
-
Synchronized display of vx/vy horizontal and vz vertical velocities
-
Real-time playback control (0.1-10x speed) for dynamic analysis
Practical benefits:
-
X-axis acceleration shows vx positive-phase growth
-
Y-axis turns produce immediate vy response
-
80% faster identification of drift/integration anomalies than single-dimension analysis
3. FFT Transformation
Built-in Fast Fourier Transform with one-click vibration spectrum generation:
Workflow for vibration analysis:
-
Identify resonance frequencies via FFT
-
Set cutoff frequencies
-
Observe filtering effects without data export
Attitude Curve Conversion Steps:
a) Data selection:
-
Search vehicle_attitude topic
-
Expand quaternion array q[4]
b) Math transformation:
-
Tools → Quaternion to RPY
-
Input q[0]-q[3] (W,X,Y,Z)
-
Save configuration
c) Visualization:
-
Select roll/pitch/yaw under Custom Series
-
Drag to display panel
Technical implementation:
Automated quaternion-to-Euler conversion using:
roll = atan2(2*(q0q1+q2q3),1-2*(q1²+q2²))
Eliminates manual coding requirements
PID Tuning Guidance:
-
Response lag → Increase P gain
-
Overshoot → Reduce P gain
-
Acceptable amplitude → Add D term
-
Steady-state error → Introduce I term
Classic Case Studies
1. Vibration Analysis & Parameter Tuning via FFT
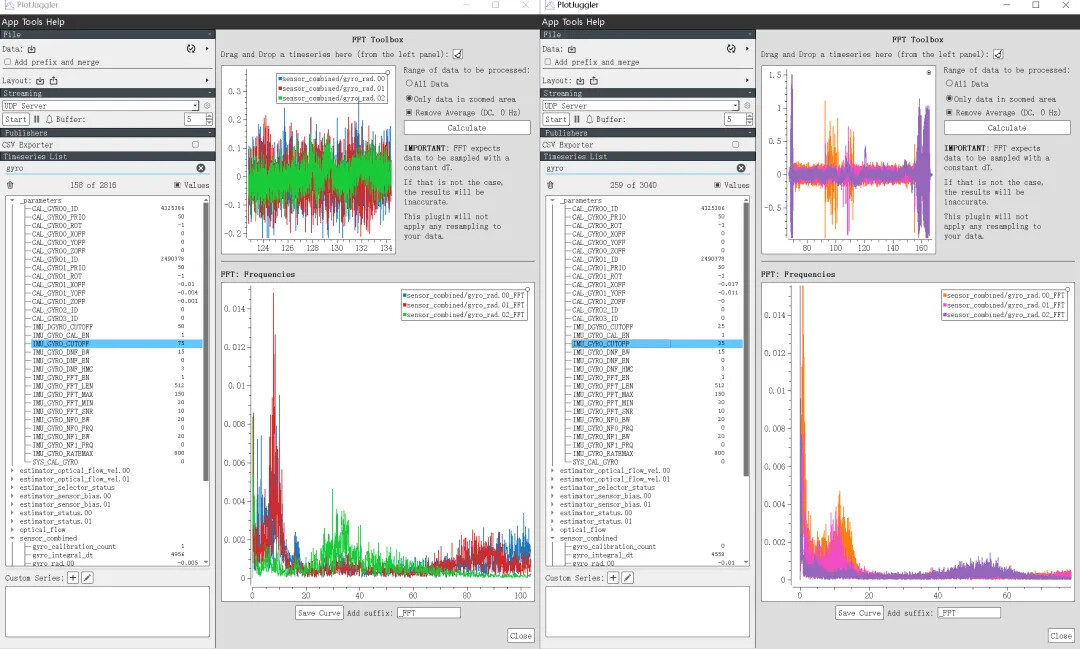
Scenario:
During drone hover log analysis, FFT frequency spectrum revealed:
- With IMU_GYRO_CUTOFF=75Hz & IMU_DGYRO_CUTOFF=50Hz, a prominent 25Hz airframe vibration was detected (left plot).
- After adjusting cutoff frequencies to 35Hz/25Hz, the vibration was eliminated (right plot), significantly improving flight stability.
Key Insight:
FFT-based spectral analysis enables precise identification and mitigation of structural/control vibrations by optimizing filter parameters.
2. Altitude Anomaly Diagnosis
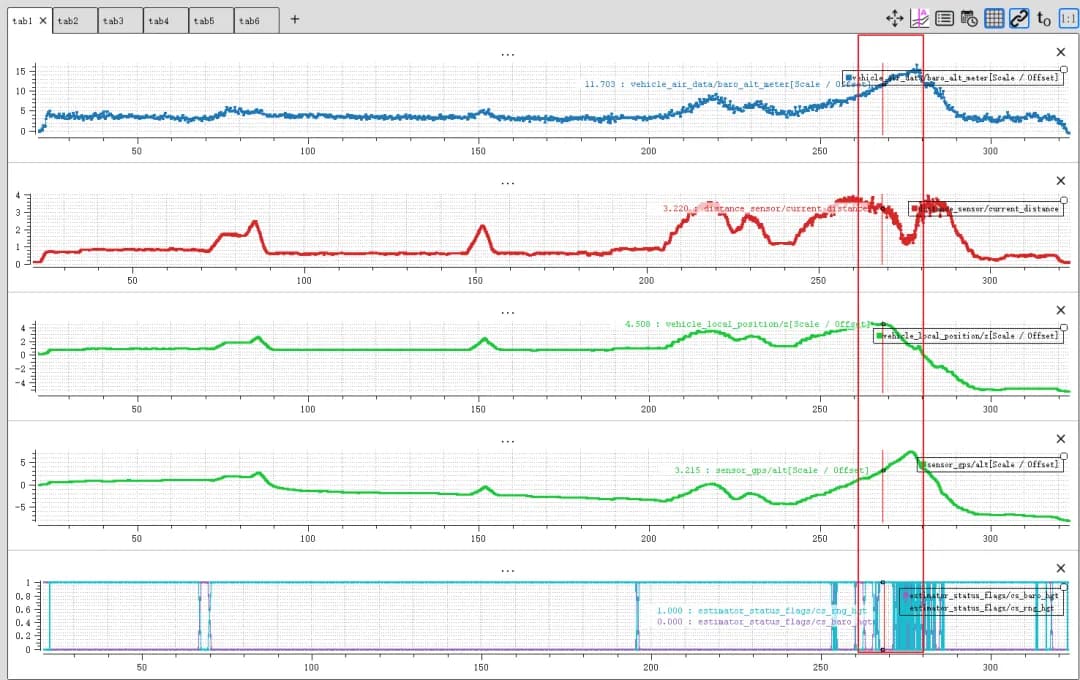
Log Analysis Findings:
| Plot | Data Source | Observation |
|---|---|---|
| ① | Barometer | Matched GPS altitude trend |
| ② | Rangefinder | Output contradicted baro/GPS |
| ③ | Fused Height | Erratic due to faulty rangefinder input |
| ④ | GPS | Consistent with barometer |
| ⑤ | Altitude Source Flag | Rapid switching between sources |
Root Cause:
- EKF2_RNG_AID parameter enabled fusion of rangefinder data (which was faulty).
- The EKF2 estimator oscillated between baro (correct) and rangefinder (erroneous), causing altitude divergence.
Solution:
Disable rangefinder aiding (EKF2_RNG_AID=0) or recalibrate the sensor.
Resource Download
- Software Installation : PlotJuggler Releases (GitHub)
Note: For Windows 11, use v2.8.4 to avoid compatibility issues. - Official Guide : PX4 Log Analysis with PlotJuggler
Common Parameter Reference
For detailed uORB message definitions, consult:
PX4 uORB Message Documentation