Hello, everyone! I have met a question when I analyze my data. Could you help me please?
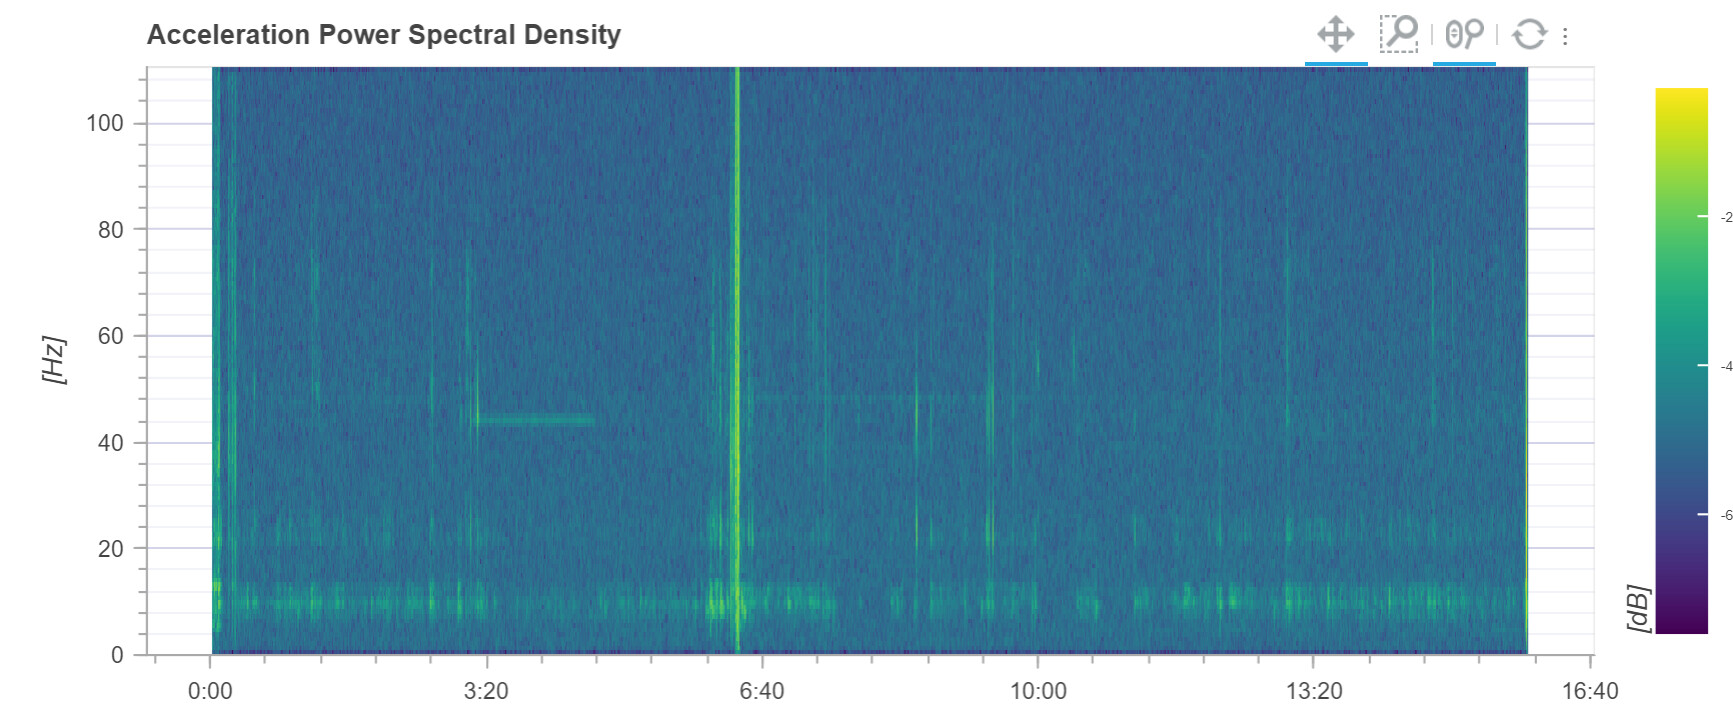
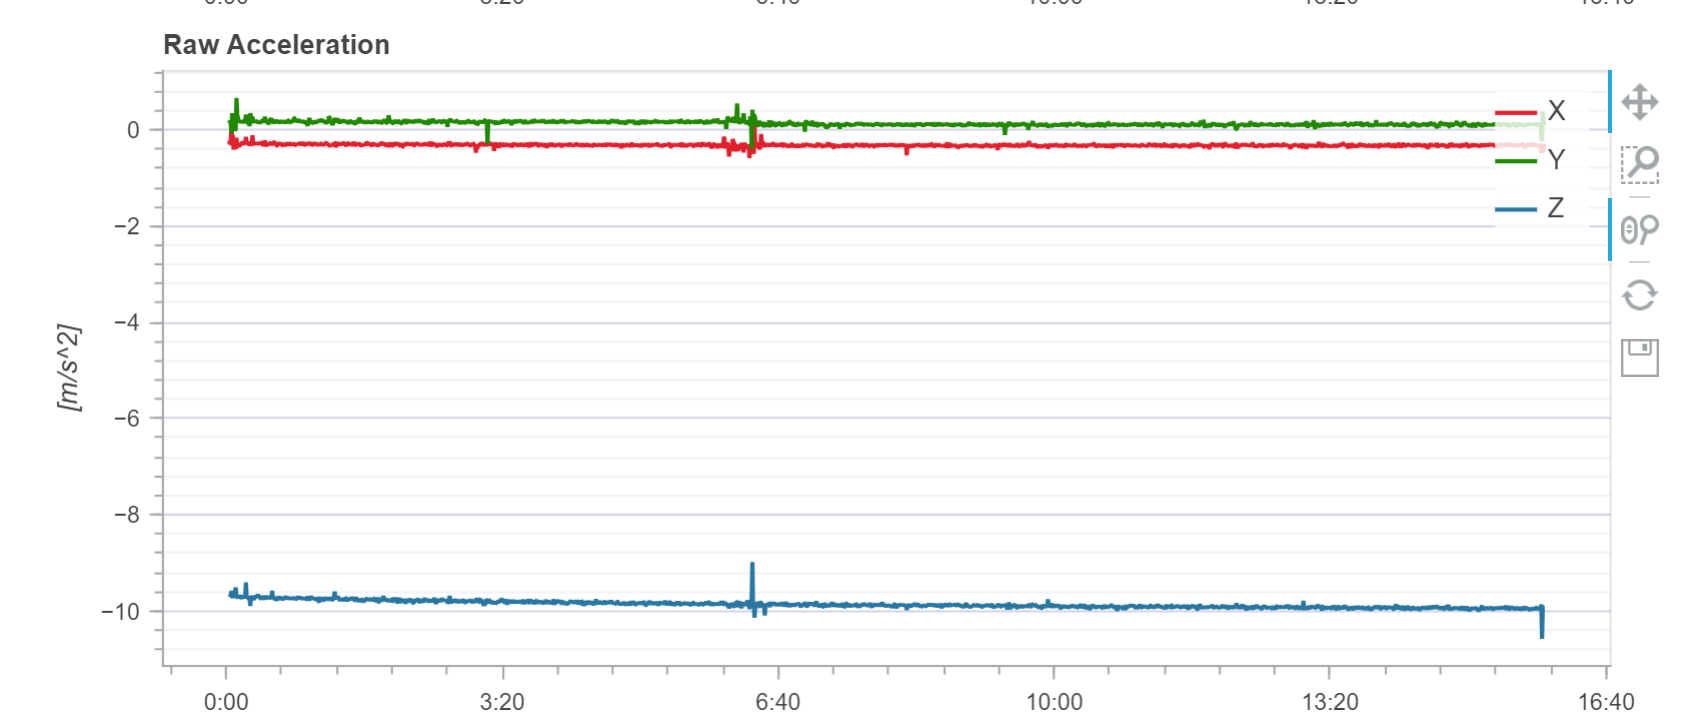
I placed the quadrotor on my desk for some minutes. And I download the data and analyze it on the website of flight review. I find the acceleration of x, y and z almost constant number 0 and -9.8 m/s2. But I find the image of ‘acceleration power spectral density’ a little puzzling. I cannot find a yellow line at 0 Hz, which represent the constant number of 0 and -9.8 m/s2. How can we explain this phenomenonn? Or does it just have a problem, where the image is wrong with lacking the yellow line at 0 Hz?