I am working on an open-source application in conjunction with a university. Its main function is to produce risk maps based on census data, transient road data and other sources. From there specific weather and flight conditions, as well as aircraft parameters, can be implemented and a “fatality risk per hour” map can be produced.
In the app, this map is used to feed into pathfinding algos and find optimum paths with the least fatality risk for drones to go along. I wondered whether this might be something that can be implemented into QGroundControl and if anyone had any tips on how to get started with it. The Source code can be found here: GitHub - aliaksei135/seedpod_ground_risk: Ground Risk model for UAS flight path analysis and risk-aware pa . Looking forward to getting it implemented as a future in QGround Control as hopefully it can be used to inform on safe areas to fly in your area!
1 Like
Could you describe with screenshots, what’s the output of the ground risk algorithm. Are these colored polygons or rectangles (vector data)? Or is it pixel oriented maps?
Further I would split your task in two topics:
1 display ground risk
2 flight path planning support (automatic,etc)
Hi there, apologies for the late reply, I have been on leave.
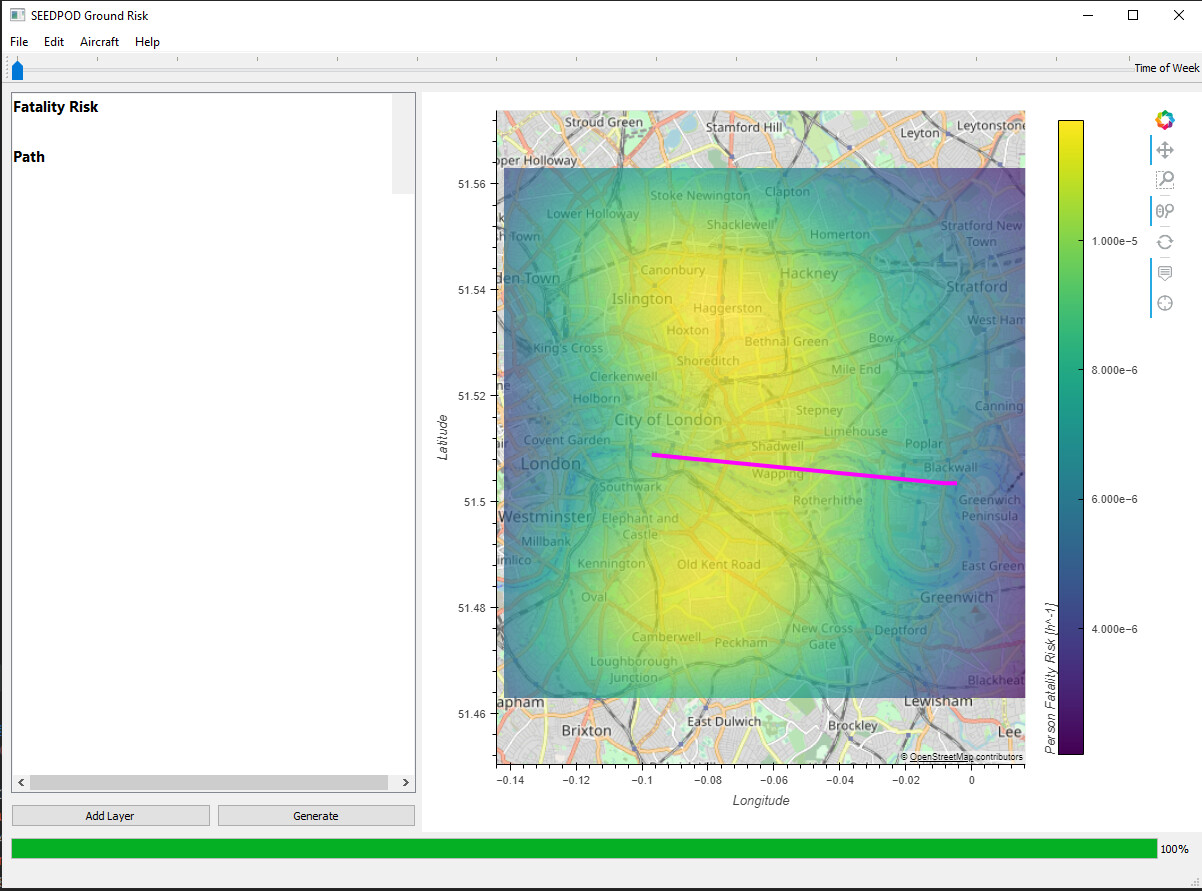
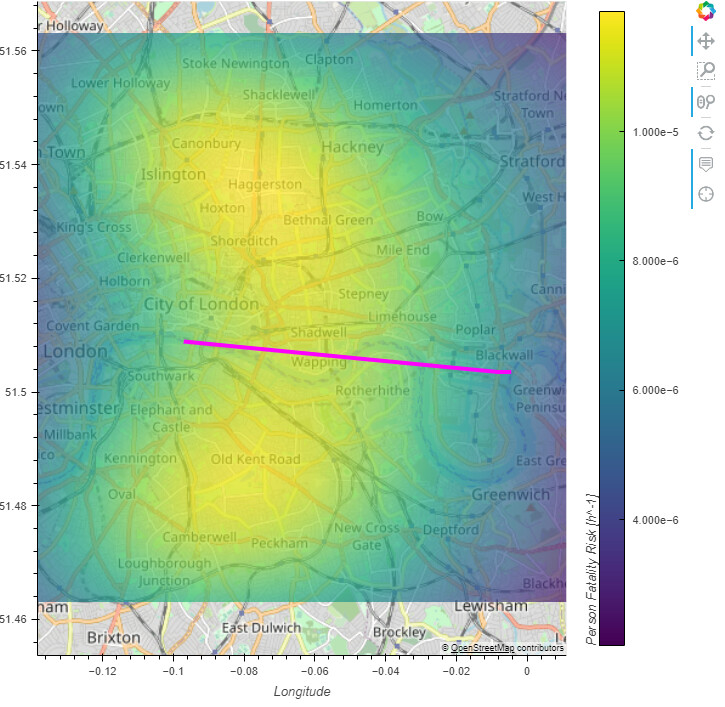
It takes the form of a translucent colour-mapped layer that can be placed over the original map. There is an example shown below. The main aim for me is to get that risk map displayed along with some statistics about the journey. If a UAV’s track can be produced on this system (I am new to QGroundControl!) then that GEOjson file can be put in and a “risk per hour” calculated for that journey.
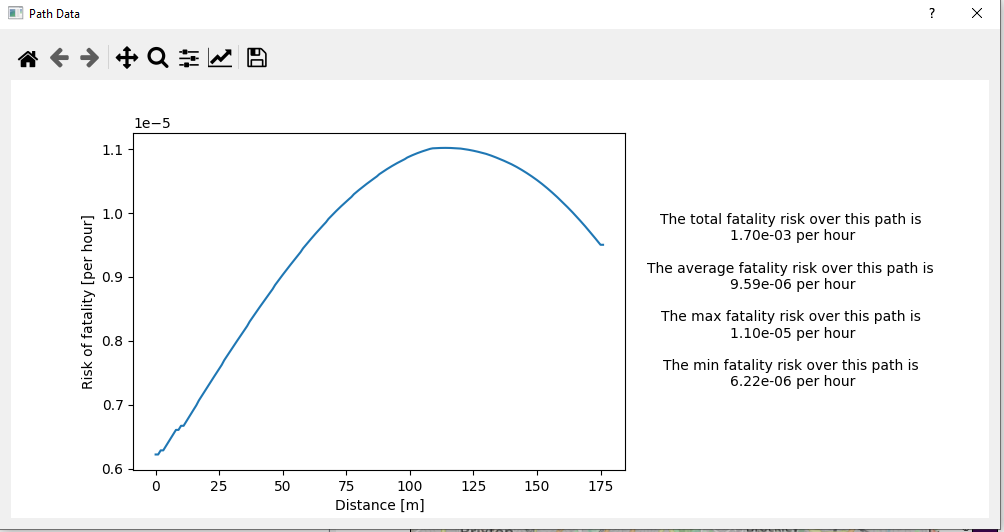
I’ve attached an image below of a risk map and a path found through London. It also shows a list of statistics about said journey. Obviously the current system is still in production however I would really love to be able to impliment it into QGC!
So the ground risk output shown above is a pixel based graphic, that needs to be overlayed to the map.
Display Ground Risk Map
QGroundContgrol support adding various Map Providers, which store their map tiles on the map providers server. QGC request the tiles by URL:
e.g the JapanReliefMap is integrated just with the code below:
static const QString JapanReliefMapUrl = QStringLiteral("https://cyberjapandata.gsi.go.jp/xyz/relief/%1/%2/%3.png");
QString JapanReliefMapProvider::_getURL(const int x, const int y, const int zoom, QNetworkAccessManager* networkManager) {
    Q_UNUSED(networkManager)
    return JapanReliefMapUrl.arg(zoom).arg(x).arg(y);
}
So your first step would be to provide a map server based on tiles representing the ground risk level.
What’s new in your case is that you want to overlay your tiles to an existing map.
To do that there are two possibilities:
- Overlay it already on your server, providing a SateliteMap + GroundRisk, or.
- Overlay it in QGC.
If you choose solution 1, the integration to QGroundcontrol is more or less just the code lines above I have posted.
If you choose solution 2, you have a) make sure that the currently selected Map Provider in QGC uses the same Geo-Projection (e.g Web Mercator Projection) as your own Ground Risk Tile server.
and b) you need to extend QGC to somehow display two Map Server on top each other. (QGC uses QT Map: see Map QML Type | Qt Location 5.15.5). If that would work and how, can also be tested outside QGC using Map demo projects from Qt.
Some Info on map tiles (e.g Map Tiles and Cached Map Services | GoGeomatics
Display Ground Risk Graph and Calculation
To display the calculation of the ground risk I would just send the coordinates of the planned mission to your server, and send back the risk data as sequence of lon,lat,risk.
A local risk calculation within QGC would only work if you choose Solution 2 above (Overlay risk map in QGC) because then you can access the clean risk tile, and get the risk value from that tile.