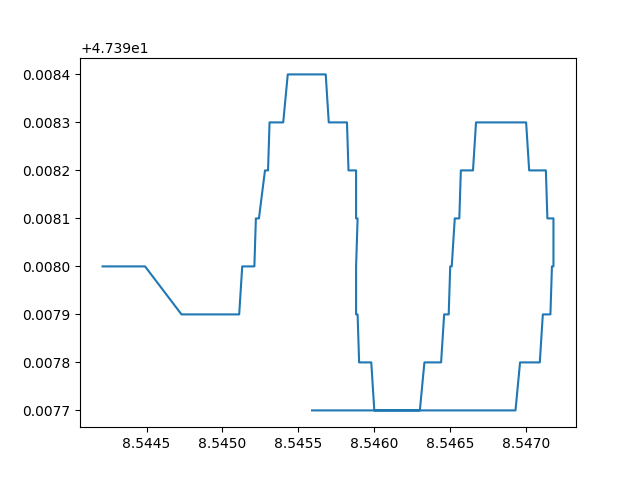
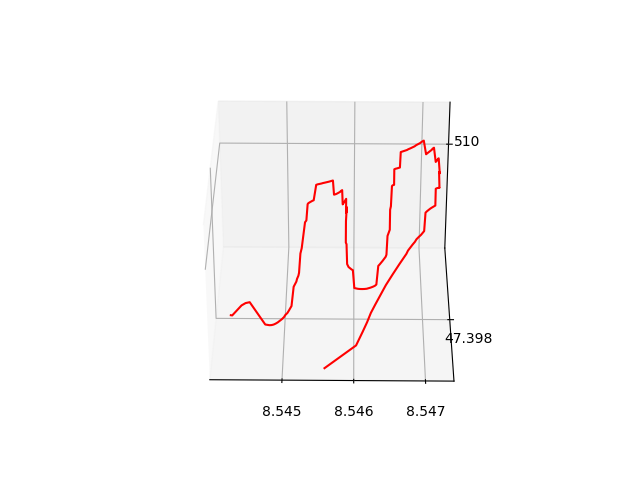
I want to draw 3d-trajectory of my flight using the coordinate information in class TrajectoryPoints . But when I draw the trajecotry using the coordinate information with matplotlib .I get such a picture.
It seems the longitude and latitude data is not very precise. So where can I get the precise data I need in QGC.
Thanks!
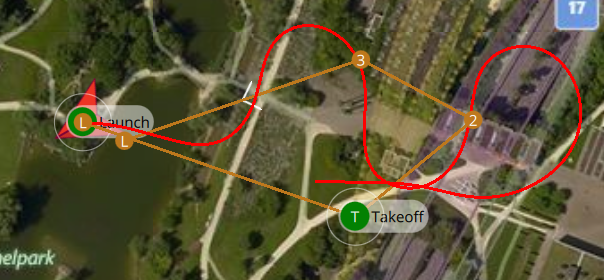
Hi, I have checked my code and can’t find something wrong. The trajectory points data I get from class TrajectoryPoints are not enough to draw a 2d trajectory (as the picture above )as precise as the red lines draw on the map in QGC main window .
As I said if what you see from flight trajectory in QGC doesn’t match what you get in your code then there is likely something wrong with your code.
If you want something fancy to display really high quality flight paths and/or spline paths then you should be using telemetry values or vehicle flight logs not trajectory points for gps positions. If you look at the Trajectory point code you will see that they are filtered for performance while still providing a decent representation of the flight path as stated in the comment in the code:
    // The goal of this algorithm is to limit the number of trajectory points whic represent the vehicle path.
    // Fewer points means higher performance of map display.
``