I have just started using PX4Tools, which I find very convenient ! thanks for creating this @jgoppert !
I’m not familiar with pandas however, so struggling a little to know how to plot two variables with different number of samples, in my case
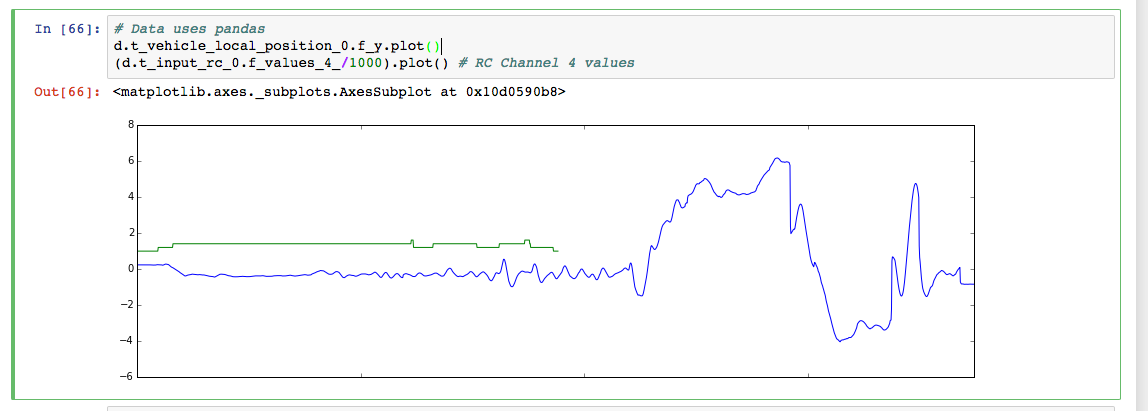
d.t_vehicle_local_position_0.f_y.plot()
(d.t_input_rc_0.f_values_4_/1000).plot()
So my basic question is how I could plot them both in the same X,Y plot with X being the timestamp ( Ideally time in the same format as the log.px4.io website)
@jgoppert, would you have any suggestions?
Currently this is what I get: