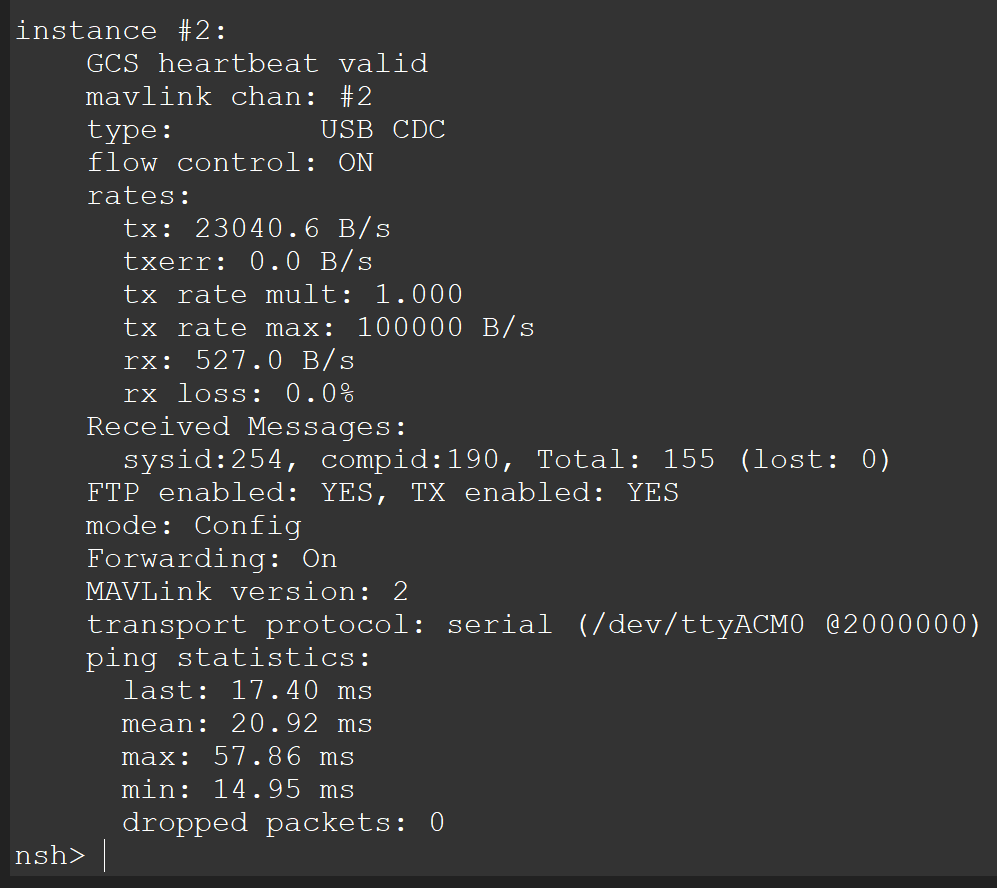
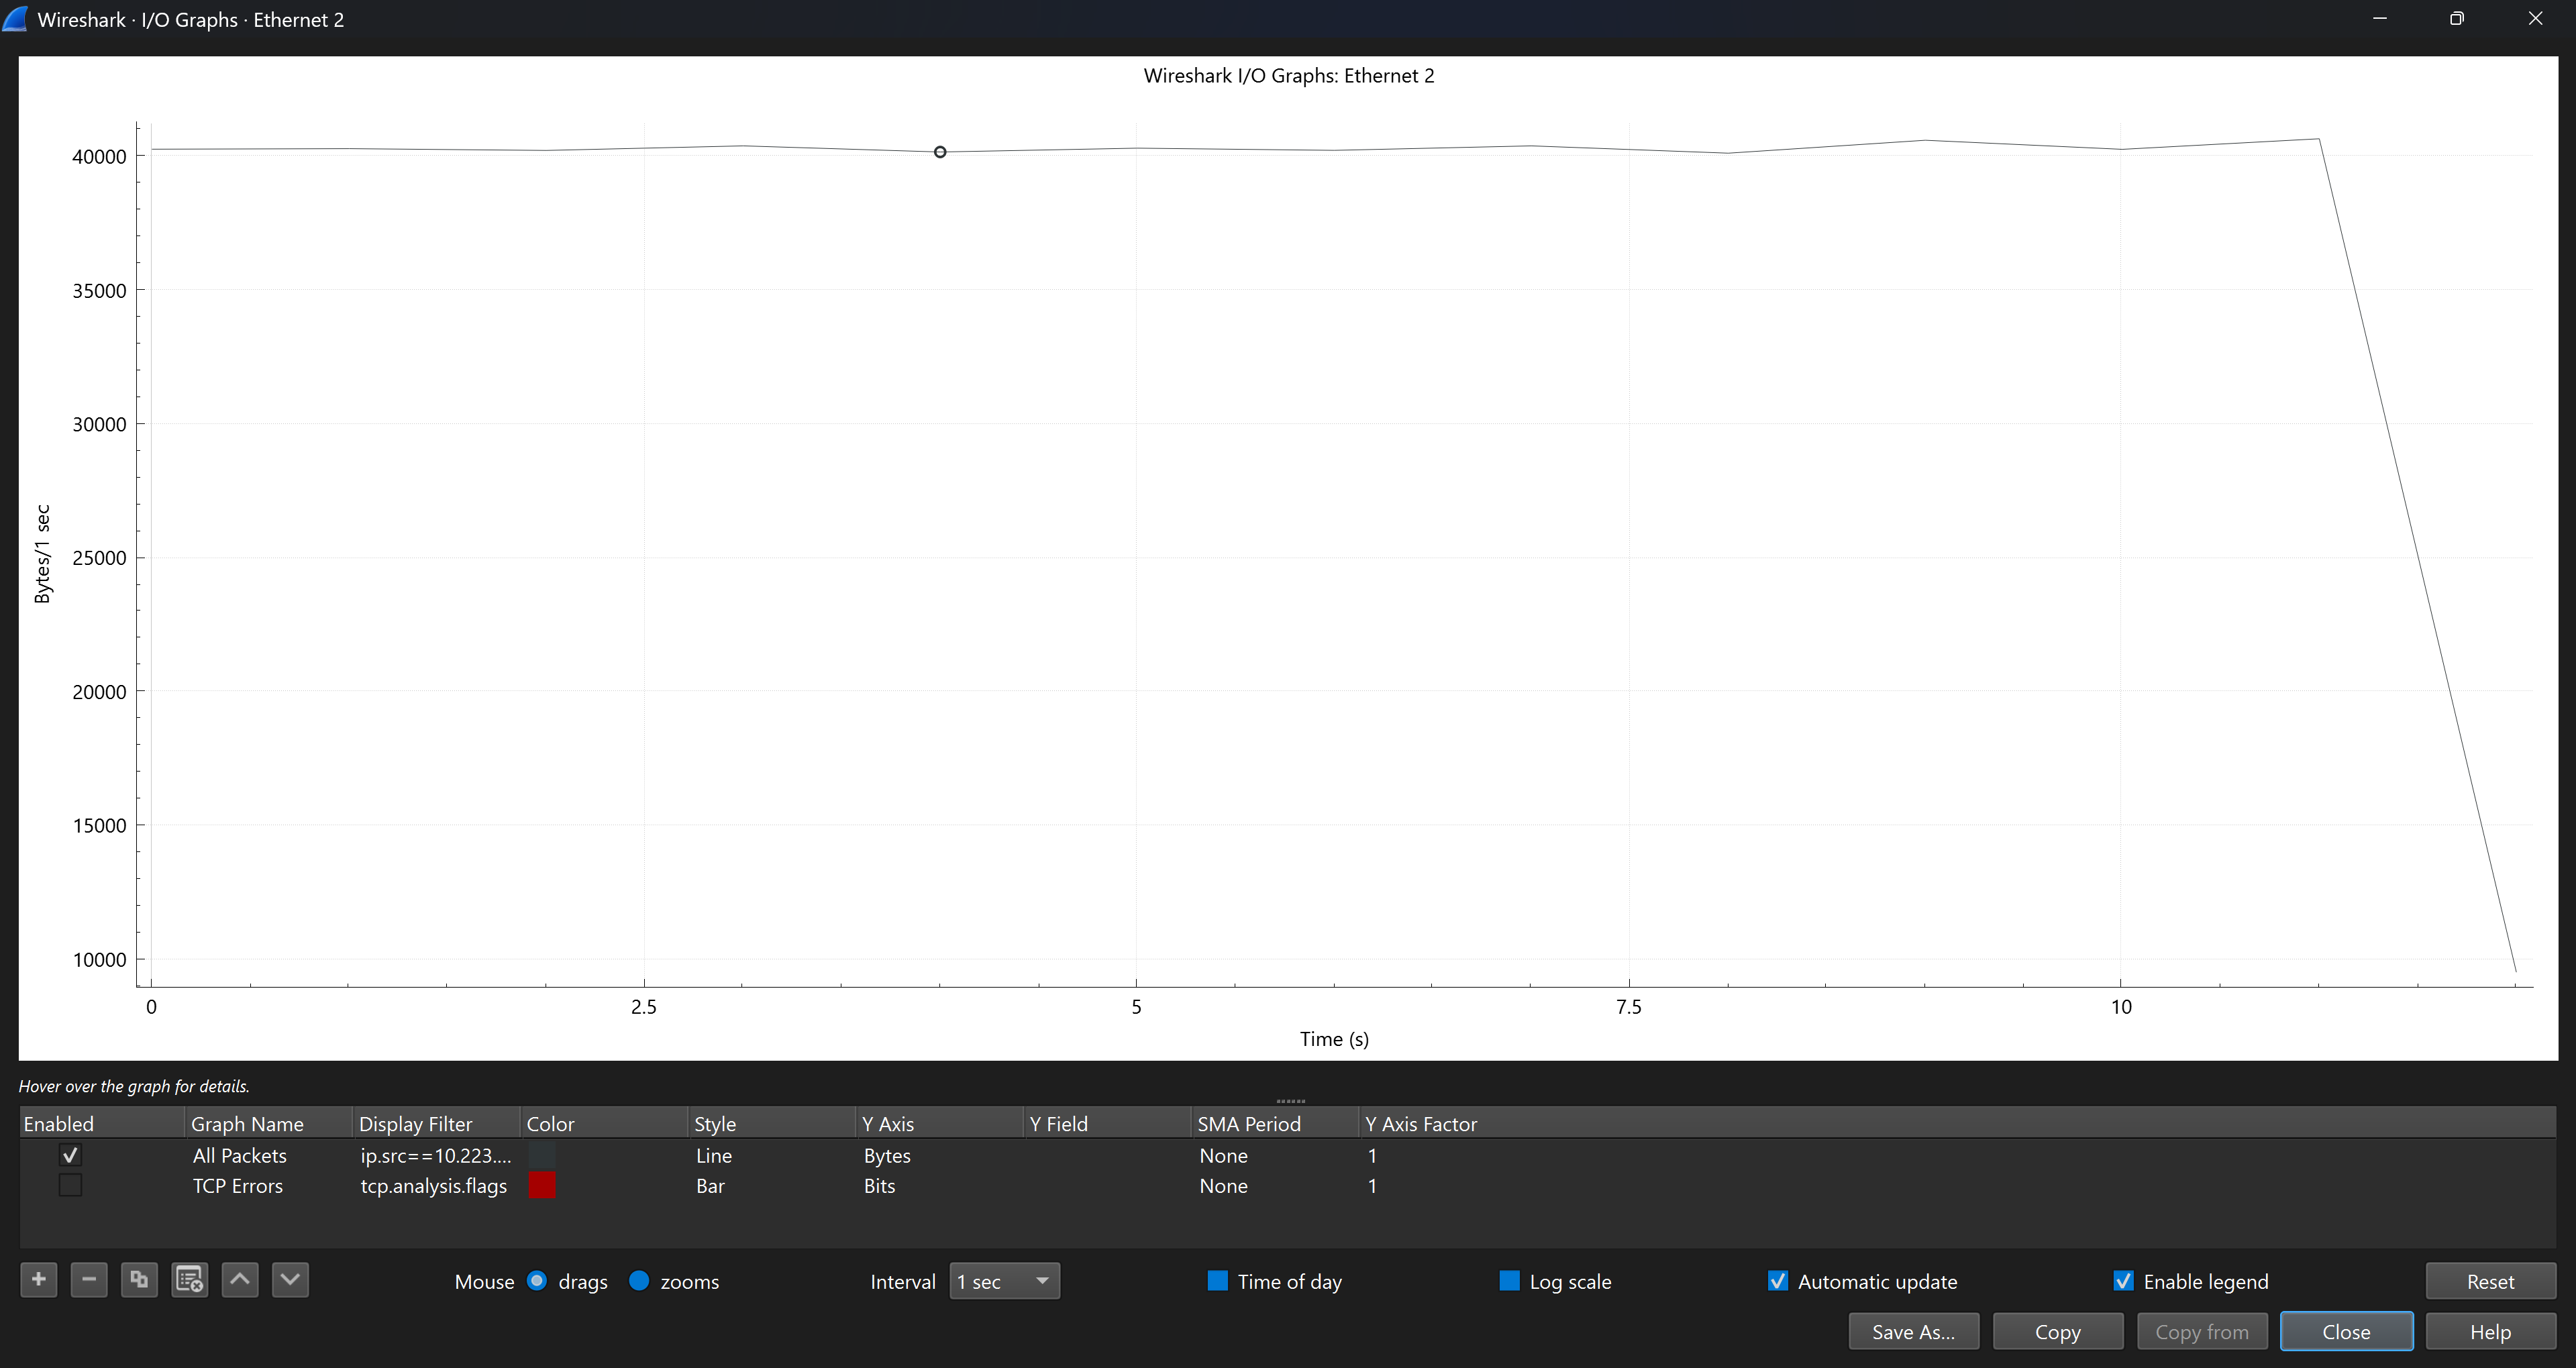
In the PX4 mavlink console, running “mavlink status” reports that the autopilot is sending about 23 kilobytes per second to the GCS. However, Wireshark on my GCS says that it is receiving 40 kilobytes per second of Mavlink messages. Why is there a discrepancy?
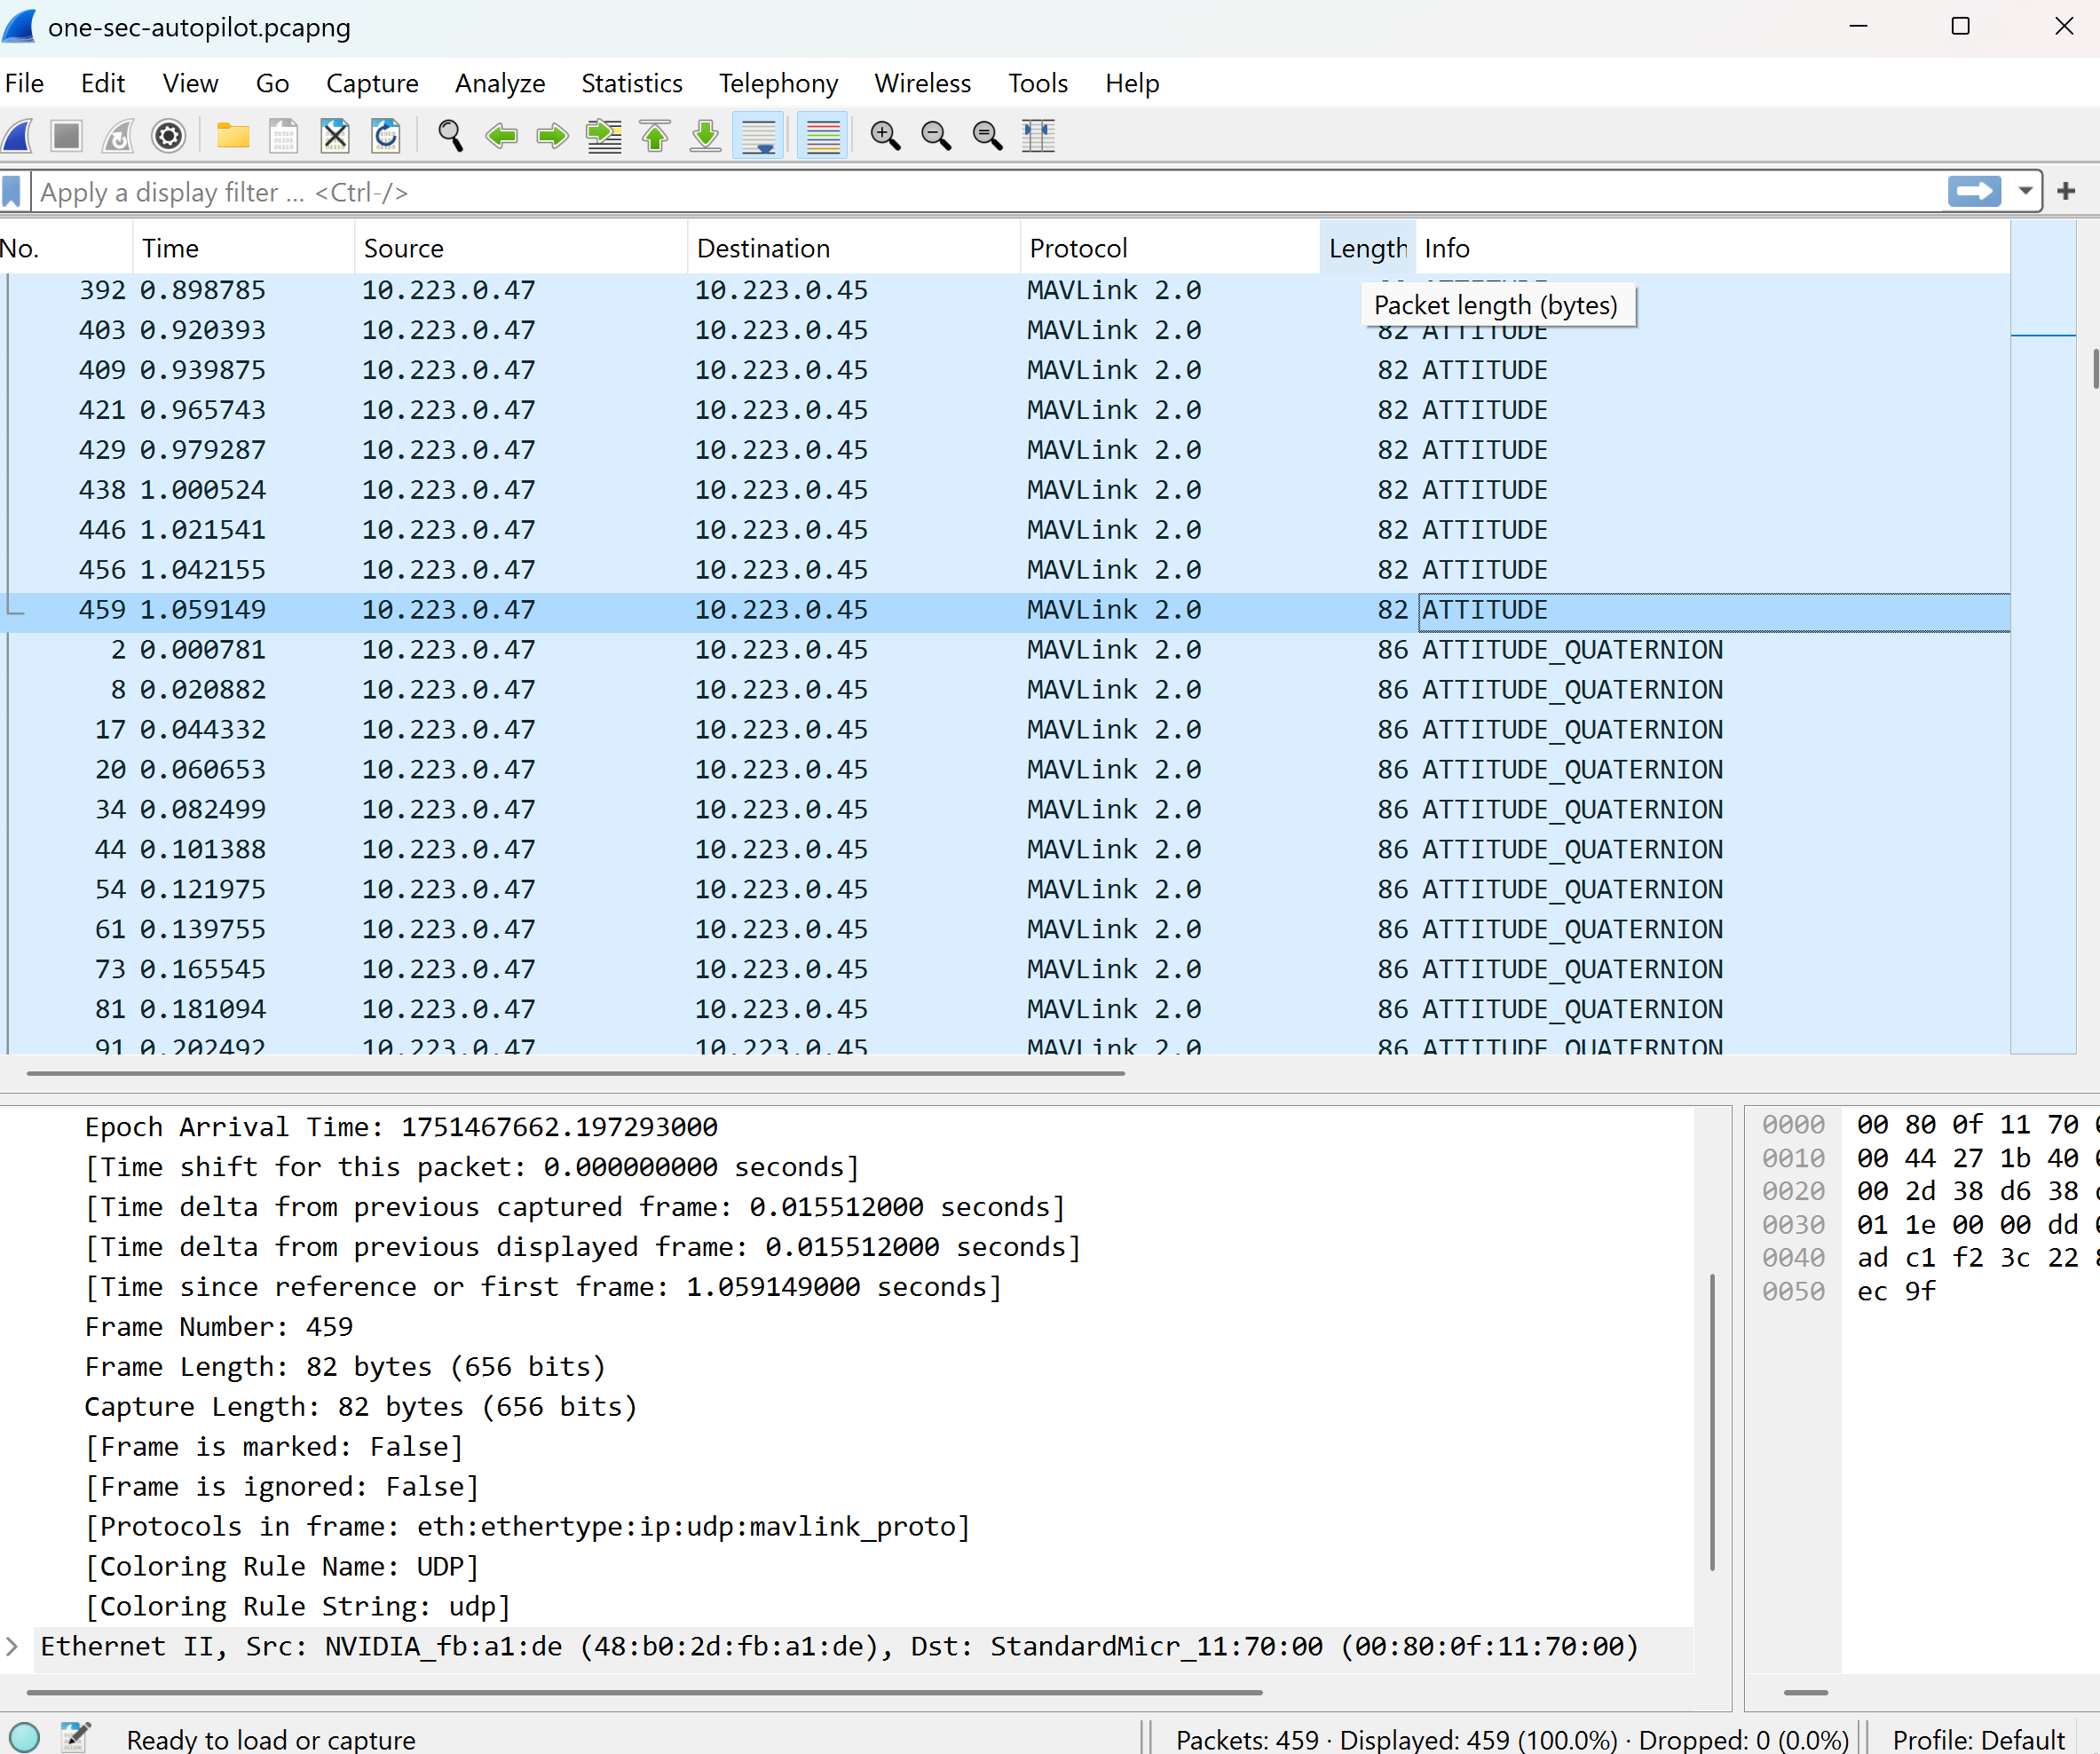
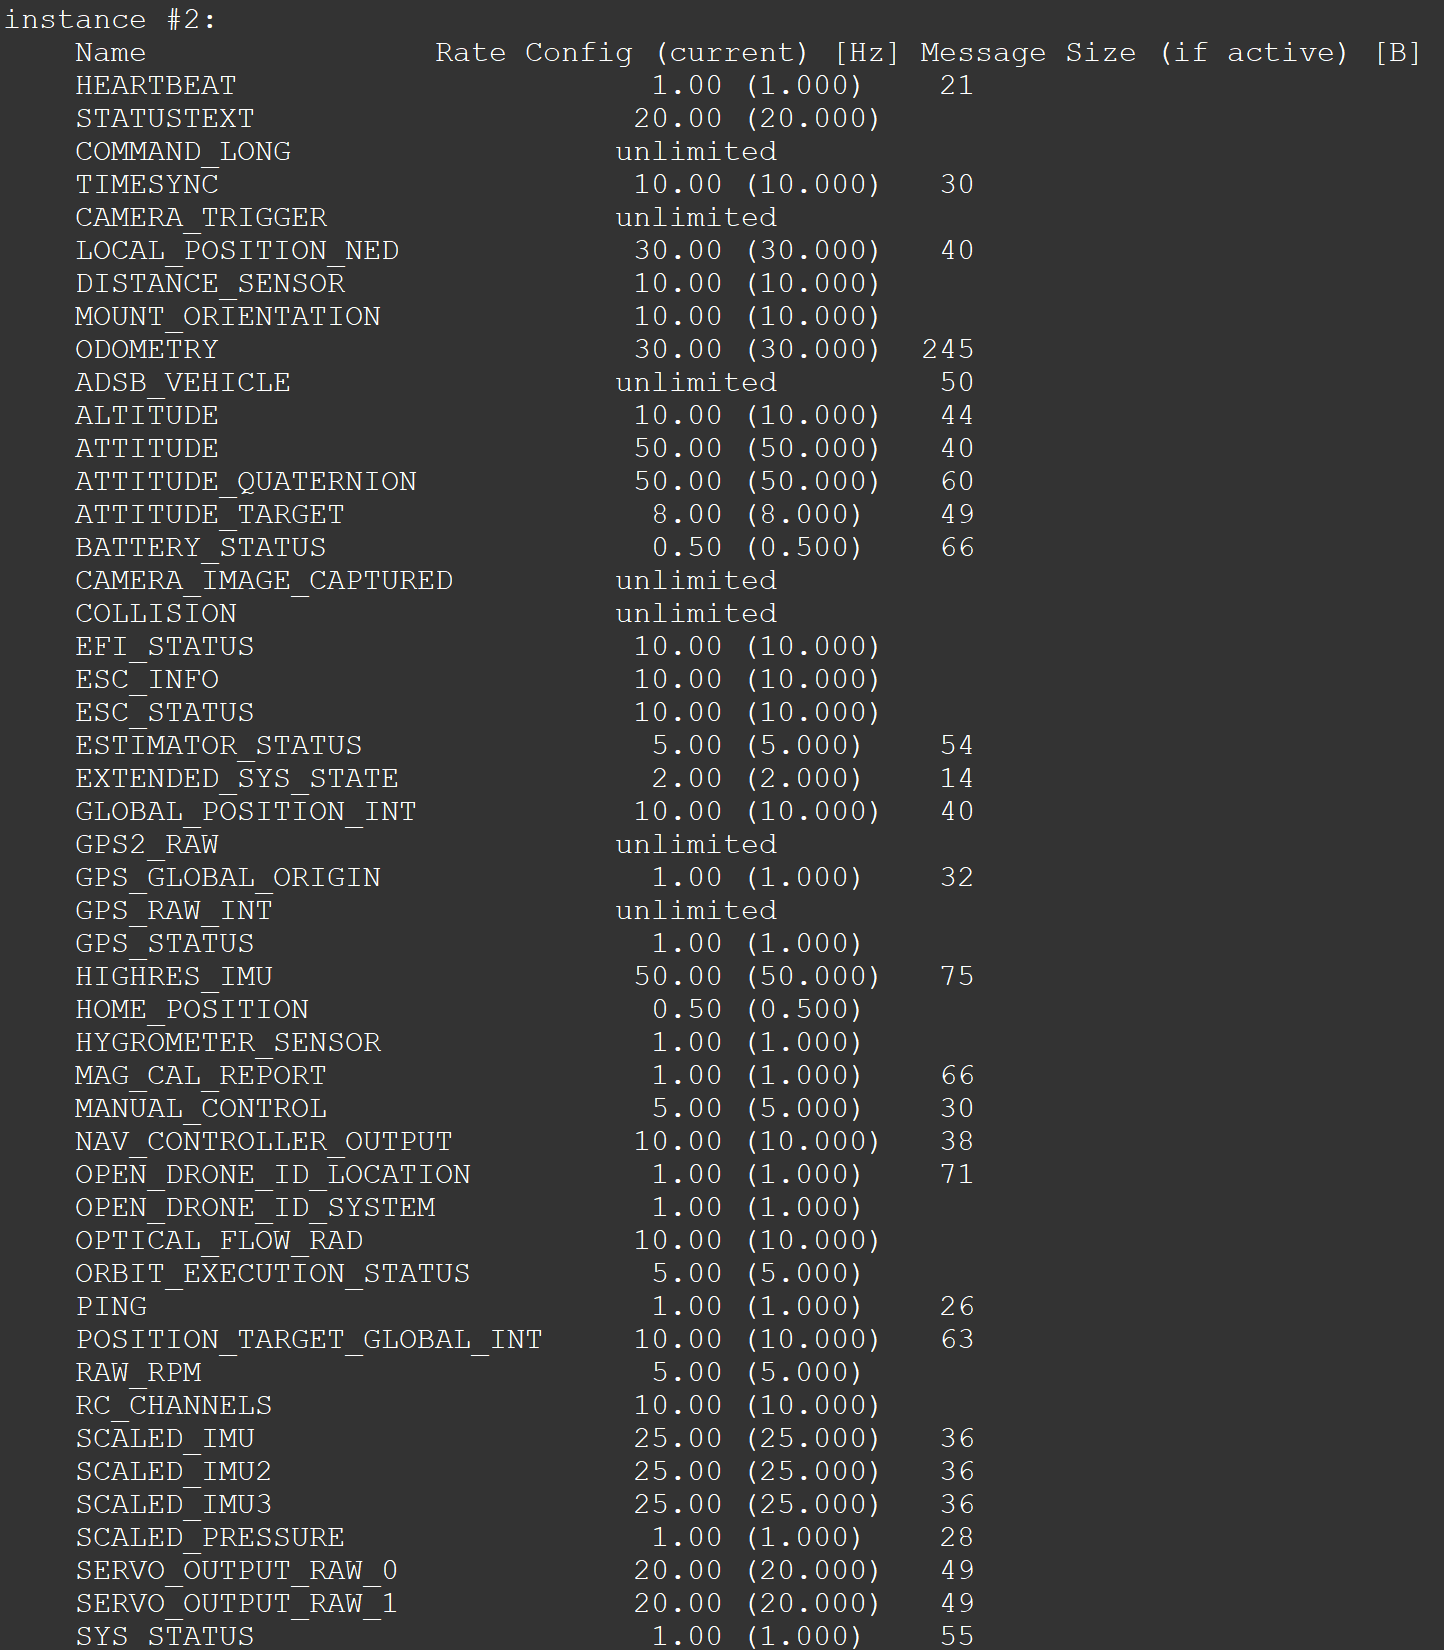
It appears that PX4 thinks that the size of mavlink messages are on average about 30 bytes less than what Wireshark thinks. For example, “mavlink status streams” says that the ATTITUDE message is 40 bytes and ATTITUDE_QUATERNION is 60 bytes, while Wireshark says that they are 82 and 86 bytes, respectively.
If I add 30 bytes onto the PX4 reported message sizes and calculate using the frequencies, then PX4 would be reporting 40 kilobytes per second, the same as Wireshark.
“mavlink status” bytes/s:
Wireshark bytes/s:
“mavlink status streams” message sizes:
Wireshark message sizes: