I am running PX4 release/1.14 on 6X module.
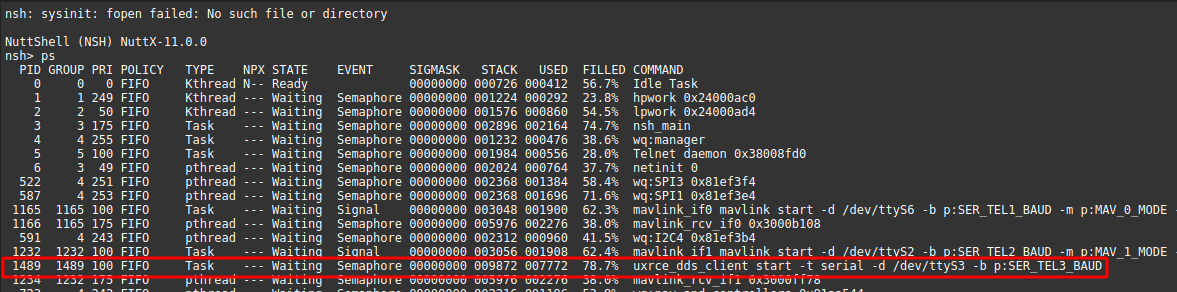
When checked the status of uxrce_dds_client, I noticed FILLED indicating 93.1%!
Is this normal? What is causing this large amount of FILLED?
nsh> ps
  PID GROUP PRI POLICY   TYPE    NPX STATE    EVENT     SIGMASK   STACK   USED  FILLED COMMAND
    0     0   0 FIFO     Kthread N-- Ready              00000000 000726 000476  65.5%  Idle Task
    1     1 249 FIFO     Kthread --- Waiting  Semaphore 00000000 001224 000292  23.8%  hpwork 0x24000ac0
    2     2  50 FIFO     Kthread --- Waiting  Semaphore 00000000 001576 000860  54.5%  lpwork 0x24000ad4
    3     3 100 FIFO     Task    --- Waiting  Semaphore 00000000 002896 002164  74.7%  nsh_main
    4     4 255 FIFO     Task    --- Waiting  Semaphore 00000000 001232 000548  44.4%  wq:manager
    5     5 100 FIFO     Task    --- Waiting  Semaphore 00000000 001984 000556  28.0%  Telnet daemon 0x38008fd0
    6     3  49 FIFO     pthread --- Waiting  Semaphore 00000000 002024 000780  38.5%  netinit 0
 1865  1865 100 FIFO     Task    --- Waiting  Signal    00000000 003144 001996  63.4%  mavlink_if3 mavlink start -d /dev/ttyACM0
  522     4 251 FIFO     pthread --- Waiting  Semaphore 00000000 002368 001384  58.4%  wq:SPI3 0x81ef424
  587     4 253 FIFO     pthread --- Waiting  Semaphore 00000000 002368 001696  71.6%  wq:SPI1 0x81ef414
 1868  1865 175 FIFO     pthread --- Waiting  Semaphore 00000000 005976 002692  45.0%  mavlink_rcv_if3 0x30028608
 1869  1869 100 FIFO     Task    --- Running            00000000 002000 001484  74.2%  mavlink_shell
 1486  1461 175 FIFO     pthread --- Waiting  Semaphore 00000000 005976 002292  38.3%  mavlink_rcv_if2 0x30017ce8
  591     4 243 FIFO     pthread --- Waiting  Semaphore 00000000 002312 000960  41.5%  wq:I2C4 0x81ef3e4
 1872  1869  49 FIFO     pthread --- Waiting  Semaphore 00000000 002024 000692  34.1%  netinit 0
 1233  1233 100 FIFO     Task    --- Waiting  Signal    00000000 003048 001980  64.9%  mavlink_if0 mavlink start -d /dev/ttyS6 -b p:SER_TEL1_BAUD -m p:MAV_0_MODE -r p:MAV_0_RATE -f -s -x
 1234  1233 175 FIFO     pthread --- Waiting  Semaphore 00000000 005976 002292  38.3%  mavlink_rcv_if0 0x3000e488
 1043  1043 205 FIFO     Task    --- Waiting  Semaphore 00000000 001936 001236  63.8%  gps start -d /dev/ttyS0 -b p:SER_GPS1_BAUD
 1813  1813 105 FIFO     Task    --- Waiting  Semaphore 00000000 001896 001032  54.4%  navigator start
 1302  1302 100 FIFO     Task    --- Waiting  Signal    00000000 003056 001980  64.7%  mavlink_if1 mavlink start -d /dev/ttyS4 -b p:SER_TEL2_BAUD -m p:MAV_1_MODE -r p:MAV_1_RATE -s -x
 1303  1302 175 FIFO     pthread --- Waiting  Semaphore 00000000 005976 002292  38.3%  mavlink_rcv_if1 0x30013238
  600   600 100 FIFO     Task    --- Waiting  Signal    00000000 009880 009204  93.1%! uxrce_dds_client start -t serial -d /dev/ttyS3 -b 921600
  729     4 242 FIFO     pthread --- Waiting  Semaphore 00000000 002216 001196  53.9%  wq:nav_and_controllers 0x81aa544
  730     4 255 FIFO     pthread --- Waiting  Semaphore 00000000 003120 002308  73.9%  wq:rate_ctrl 0x81dfc74
  732     4 241 FIFO     pthread --- Waiting  Semaphore 00000000 005976 004316  72.2%  wq:INS0 0x81ef3ec
  478     4 246 FIFO     pthread --- Waiting  Semaphore 00000000 002312 001024  44.2%  wq:I2C1 0x81ef3cc
  231     4 237 FIFO     pthread --- Waiting  Semaphore 00000000 001872 000888  47.4%  wq:hp_default 0x819bc4c
  744     4 240 FIFO     pthread --- Waiting  Semaphore 00000000 005976 004316  72.2%  wq:INS1 0x81ef3f4
  489     4 245 FIFO     pthread --- Waiting  Semaphore 00000000 002312 000840  36.3%  wq:I2C2 0x81ef3d4
  556     4 252 FIFO     pthread --- Waiting  Semaphore 00000000 002368 001964  82.9%! wq:SPI2 0x81ef41c
  749     4 239 FIFO     pthread --- Waiting  Semaphore 00000000 005976 004316  72.2%  wq:INS2 0x81ef3fc
  752   752 140 FIFO     Task    --- Waiting  Signal    00000000 003192 001492  46.7%  commander start
 1461  1461 100 FIFO     Task    --- Waiting  Signal    00000000 003048 001836  60.2%  mavlink_if2 mavlink start -u p:MAV_2_UDP_PRT -o p:MAV_2_REMOTE_PRT -m p:MAV_2_MODE -r p:MAV_2_RATE -p -x
 1847  1847 230 FIFO     Task    --- Waiting  Semaphore 00000000 003616 002532  70.0%  logger start -b 64 -t
 1850  1847  60 FIFO     pthread --- Waiting  Semaphore 00000000 001144 000388  33.9%  log_writer_file 0x30016cc0
  443     4 229 FIFO     pthread --- Waiting  Semaphore 00000000 001704 001108  65.0%  wq:ttyS5 0x81ef46c
  381   381  90 FIFO     Task    --- Waiting  Semaphore 00000000 001280 000852  66.5%  dataman
 1854     4 236 FIFO     pthread --- Waiting  Semaphore 00000000 003600 002244  62.3%  wq:uavcan 0x819d2dc
  383     4 205 FIFO     pthread --- Waiting  Semaphore 00000000 001896 001028  54.2%  wq:lp_default 0x81a1880
Also for the client status, why it is not receiving any packets?
Is this something makes FILLED up to 93% of buffer?
nsh> uxrce_dds_client status
INFO  [uxrce_dds_client] Running, connected
INFO  [uxrce_dds_client] Using transport: serial
INFO  [uxrce_dds_client] Payload tx: 51743 B/s
INFO  [uxrce_dds_client] Payload rx: 0 B/s