ecl/EKF optical flow fustion

Hi,

I am running ecl/EKF with my own IMU and optical flow measurements. Let’s say the camera and IMU are mounted as follows
imu_camera_mount

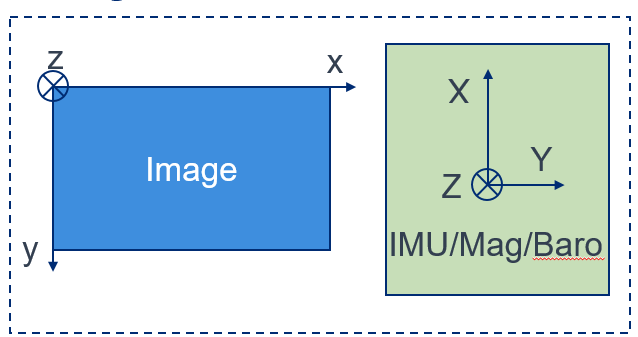
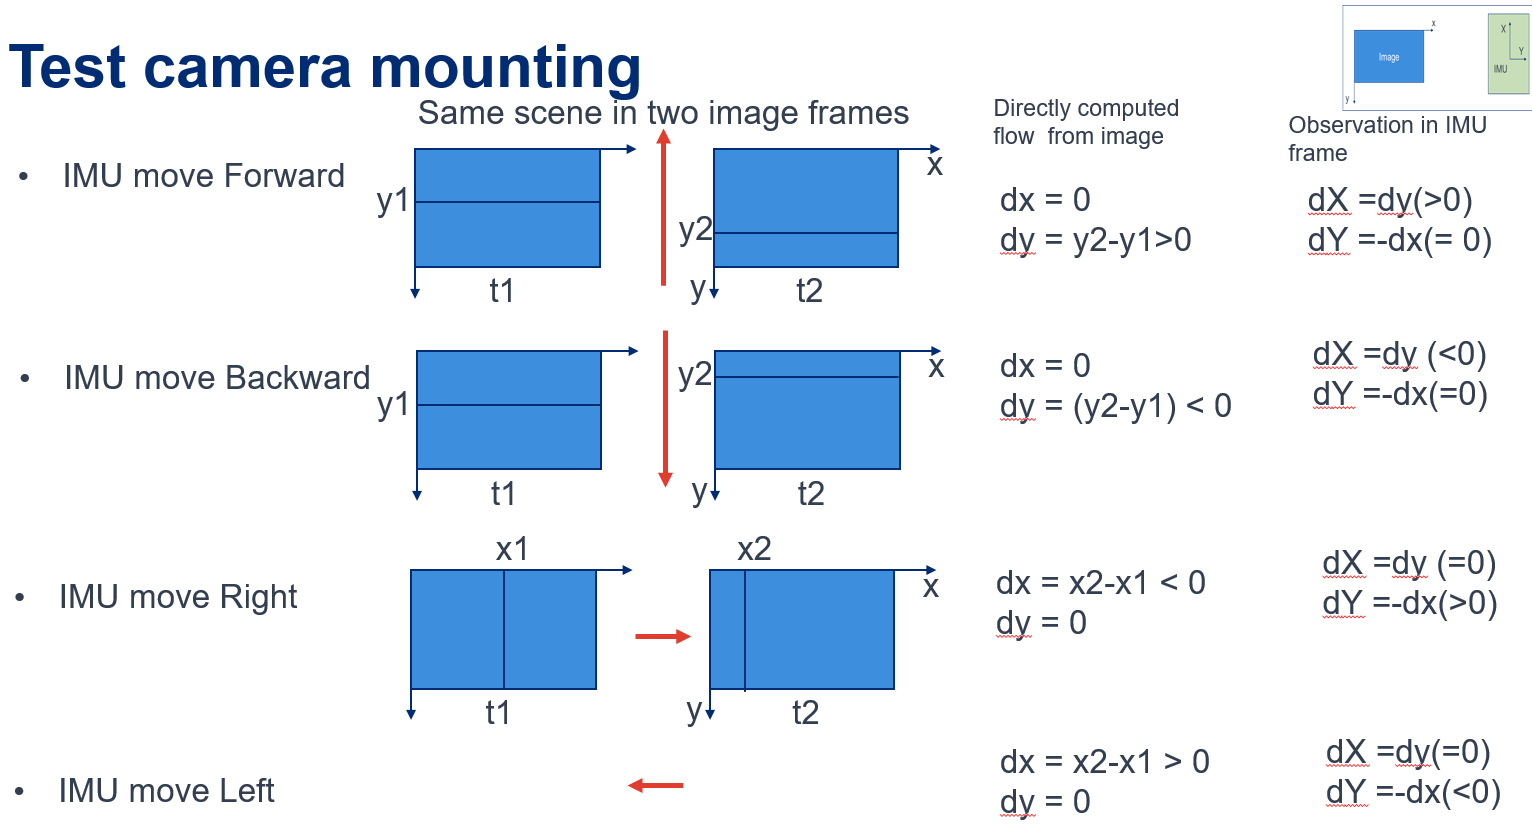
In this way, when the IMU moves forward/backward/right/left, we will have the following pixel changes

  1. IMU moves forward, dx=0, dy>0
  2. IMU moves backward, dx=0, dy<0
  3. IMU moves right, dx<0, dy=0
  4. IMU moves left, dx>0, dy=0
    This can be illustrated by

Then by using the intrinsic camera parameters (obtained by camera calibration), we can convert the pixel flow into radius flow:
flow_x_radius = dx/fx
flow_y_radius = dy/fy
where fx,fy are the focal length in pixel unit.

My question is how to fit (flow_x_radius, flow_y_radius) into flowSample data structure defined in ecl/EKF common.h?

struct flowSample {
uint64_t fn{ 0 };
uint64_t time_us{0}; ///< timestamp of the integration period leading edge (uSec)
Vector2f flow_xy_rad; ///< measured delta angle of the image about the X and Y body axes (rad), RH rotation is positive
Vector3f gyro_xyz; ///< measured delta angle of the inertial frame about the body axes obtained from rate gyro measurements (rad), RH rotation is positive
float dt; ///< amount of integration time (sec)
uint8_t quality; ///< quality indicator between 0 and 255
};

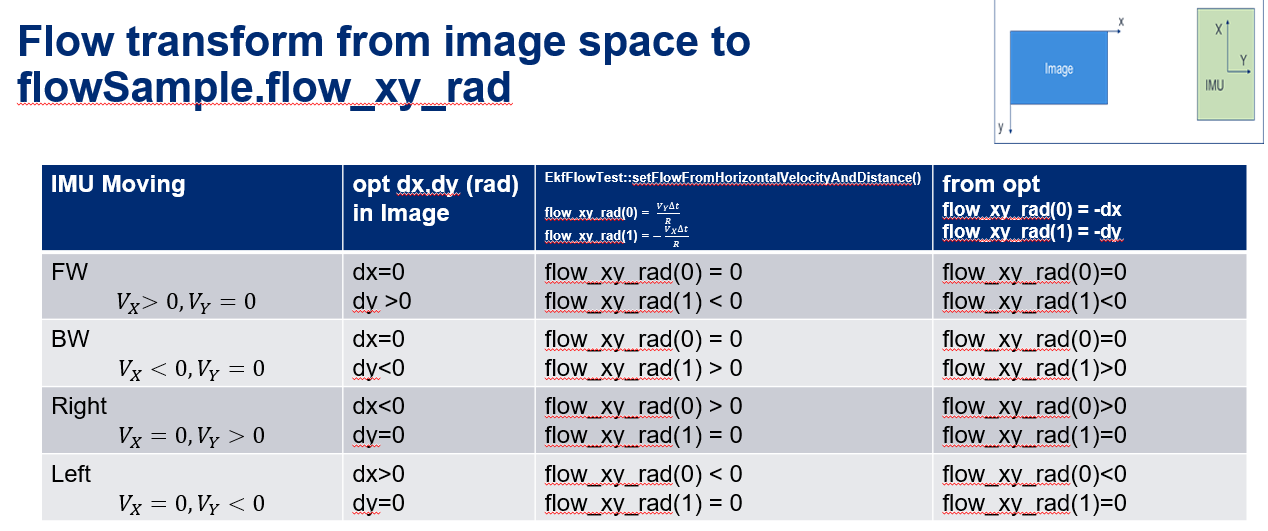
“Measured delta angle of the image about the X and Y body axes (rad), RH rotation is positive” how to interpret this sentence?

My intuitive guess is
flow_xy_rad(0) = + flow_y_radius
flow_xy_rad(1) = - flow_x_radius
but it seems does not work.

Furthermore, when dig deeper, I found the following lines of key code
in control.cpp:
L0: _flow_compensated_XY_rad = _flow_sample_delayed.flow_xy_rad - _flow_sample_delayed.gyro_xyz.xy();

in optflow_fusion.cpp:
//my comments: from prediction side
L1: const Vector3f vel_rel_earth = _state.vel + _R_to_earth * vel_rel_imu_body;
L2: const Vector3f vel_body = earth_to_body * vel_rel_earth;

//my comments: from measurement side
const Vector2f opt_flow_rate = _flow_compensated_XY_rad / _flow_sample_delayed.dt +
Vector2f(_flow_gyro_bias);
L3: _flow_vel_body(0) = -opt_flow_rate(1) * range;
L4: _flow_vel_body(1) = opt_flow_rate(0) * range;
L5: _flow_vel_ne = Vector2f(_R_to_earth * Vector3f(_flow_vel_body(0), _flow_vel_body(1), 0.f));

//innovation
L6: _flow_innov(0) = vel_body(1) / range - opt_flow_rate(0); // flow around the X axis
L7: _flow_innov(1) = -vel_body(0) / range - opt_flow_rate(1); // flow around the Y axis

L3-L7 even bothered me more for the three reasons:
a) why it switches index between 0 and 1?

b) in KF, innovation is defined by
\tilt{y}k = z_k - H_k \hat{x}{k|k-1} // observation - predictedMeasurement
why at here it uses predictedMeasurement - observation?

c) In process-and-observation-model.pdf, it says
LOS_X = -V_Y/R, LOS_Y=V_X/R,
but the code dose not match it. Also by checking matlab code, I found that both c++ and matlab use the same way, then I assume there is a typo in the document.

Thanks for your help!

Hi appletree,

I haven’t work with the ECL for a while, so take my answer with a grain of salt.

a) The optical flow measurement flow_xy_rad has been defined as some perceived rotation around the body axes that are based on movement in the pixelspace. So flow_xy_rad(0) is the perceived “rotation” around the x axis of the drone. If from the drone perspective you observe a flow that would indicate a positive rotation around the body x axis, this flow would have been produced in the abscence of any real rotation by drone movement along the positive y axis.

b) The definition for the innovation like you wrote is probably the common way. And the state update would look in this situation like this x_k = x_{k-1} + K * y. The ECL EKF defines the innovation to be y_ECL = - y. The state update in this case looks like this x_k = x_{k-1} - K*y_ECL. This is the case when you check the fuse function. Why it has been chosen to be like this, I dont know.

c) It looks to me that this might be indeed a typo in the pdf document. As you stated the cpp and also the currently used python derivation have the minus sign swapped.

Your intuitive guess might be not fully aligned with the definitions. My guess would be that:
flow_xy_rad(0) = + flow_x_radius = dx/fx
flow_xy_rad(1) = + flow_y_radius = dy/fy
It might be that both plus signs should actually be minus signs, but this you could verify by trial and error.

Hi Kritz,

Thanks for your kindness message.

From your original test_EKF_flow.cpp, optflow_fusion.cpp and EKF2::UpdateFlowSample() in PX4 EKF2.cpp, I figured out the following transformer function, it works with my current camera mount w.r.t. IMU motion in this post.

void pnt::to_ekf_smp(estimator::flowSample& z_ekf, const PntFlwSample& z, const uint64_t& t0_us)
{
     //EKF2::UpdateFlowSample()  mentioned this:
     // NOTE: the EKF uses the reverse sign convention to the flow sensor. EKF assumes positive LOS rate
       // is produced by a RH rotation of the image about the sensor axis.

       z_ekf.fn = z.img_fn;
       z_ekf.time_us = z.time_us - t0_us;    ///< timestamp of the integration period leading edge (uSec)
       z_ekf.flow_xy_rad(0) = -z.flow_x;      ///< measured delta angle of the image about the X and Y body axes (rad), RH rotation is positive
       z_ekf.flow_xy_rad(1) = -z.flow_y;           ///< measured delta angle of the image about the X and Y body axes (rad), RH rotation is positive
       z_ekf.gyro_xyz(0) = -z.integrated_x_gyro;    ///< measured delta angle of the inertial frame about the body axes obtained from rate gyro measurements (rad), RH rotation is positive
       z_ekf.gyro_xyz(1) = -z.integrated_y_gyro;   ///< measured delta angle of the inertial frame about the body axes obtained from rate gyro measurements (rad), RH rotation is positive
       z_ekf.gyro_xyz(2) = -z.integrated_z_gyro;   ///< measured delta angle of the inertial frame about the body axes obtained from rate gyro measurements (rad), RH rotation is positive
       z_ekf.dt = (float)z.dt_us / 1e6;                     ///< amount of integration time (sec)
       z_ekf.quality = z.flow_quality;                      ///< quality indicator between 0 and 255
}

To verify this, I have the following plot, hope this will help the future readers.