Hi,
I am trying to debug PX4 on my flight controller (Holybro Durandal) via its debug port with Dronecode probe and Eclipse. I have used this tutorial from the manufacturer, as well as the corresponding chapters from the PX4 documentation.
Now I can run the debugger and it seems running successfully, but problems arise when I set breakpoints. It does not seem to stop at any breakpoint, so I cannot proceed line-by-line from there, and it also gives error messages (several hundred).
I can imagine that the breakpoint cause to stop one process and it affects others, but as the debugger does not seem to stop at the breakpoint this does not sound logical.
Have anyone had success with Durandal and Dronecode probe?
Little update:
Setting the breakpoints’ type as ‘hardware’ makes the debugger stop at them. However after a few step forward the same problems appear as before (code runs, errors show up).
I just saw the video on “Hardfault debugging on PX4” from the 2020 Dev Summit by @david_s5. I was wondering if you can help me with this kind of problem?
Right now I can set multiple breakpoints, the firmware stops at the first, (constant beeping sound from the buzzer), and when I step over it the firmware starts running seemingly without breakpoints. (Even if I put the breakpoints in a loop for example in Commander.cpp, it just stops once.)
Thanks for any help and advice in advance.
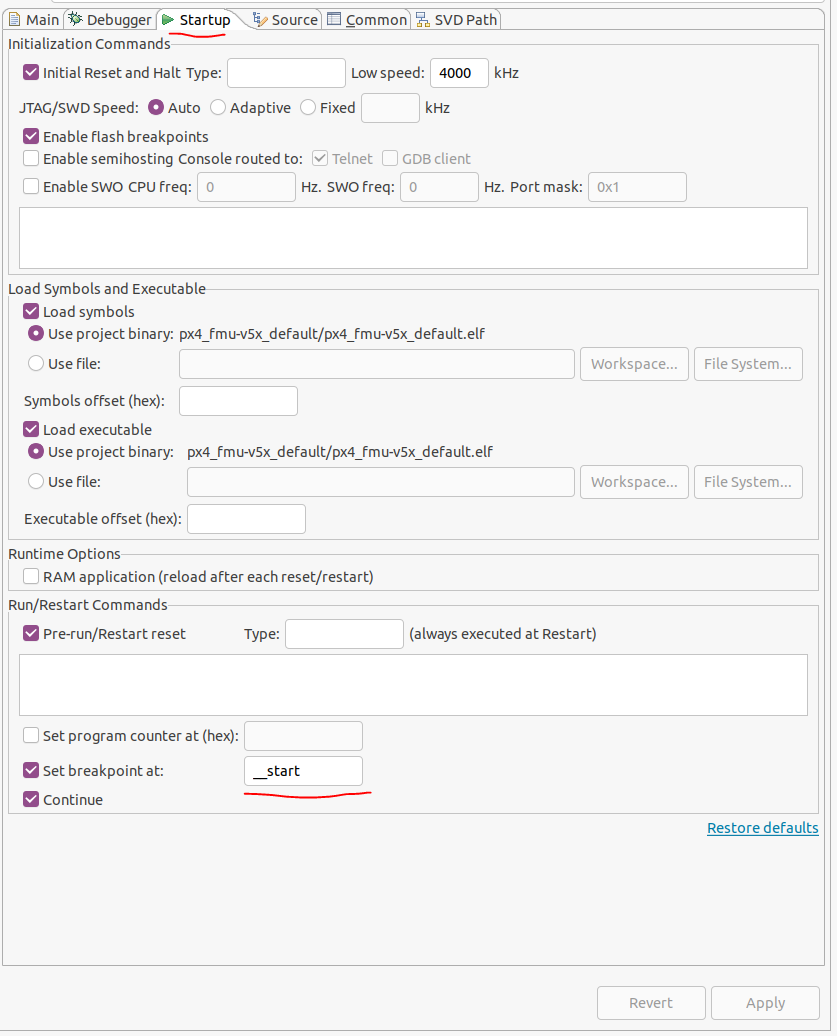
I have an idea of what it might be depending on tools and version. In the debug tabs; Change the breakpoint from main to __start .
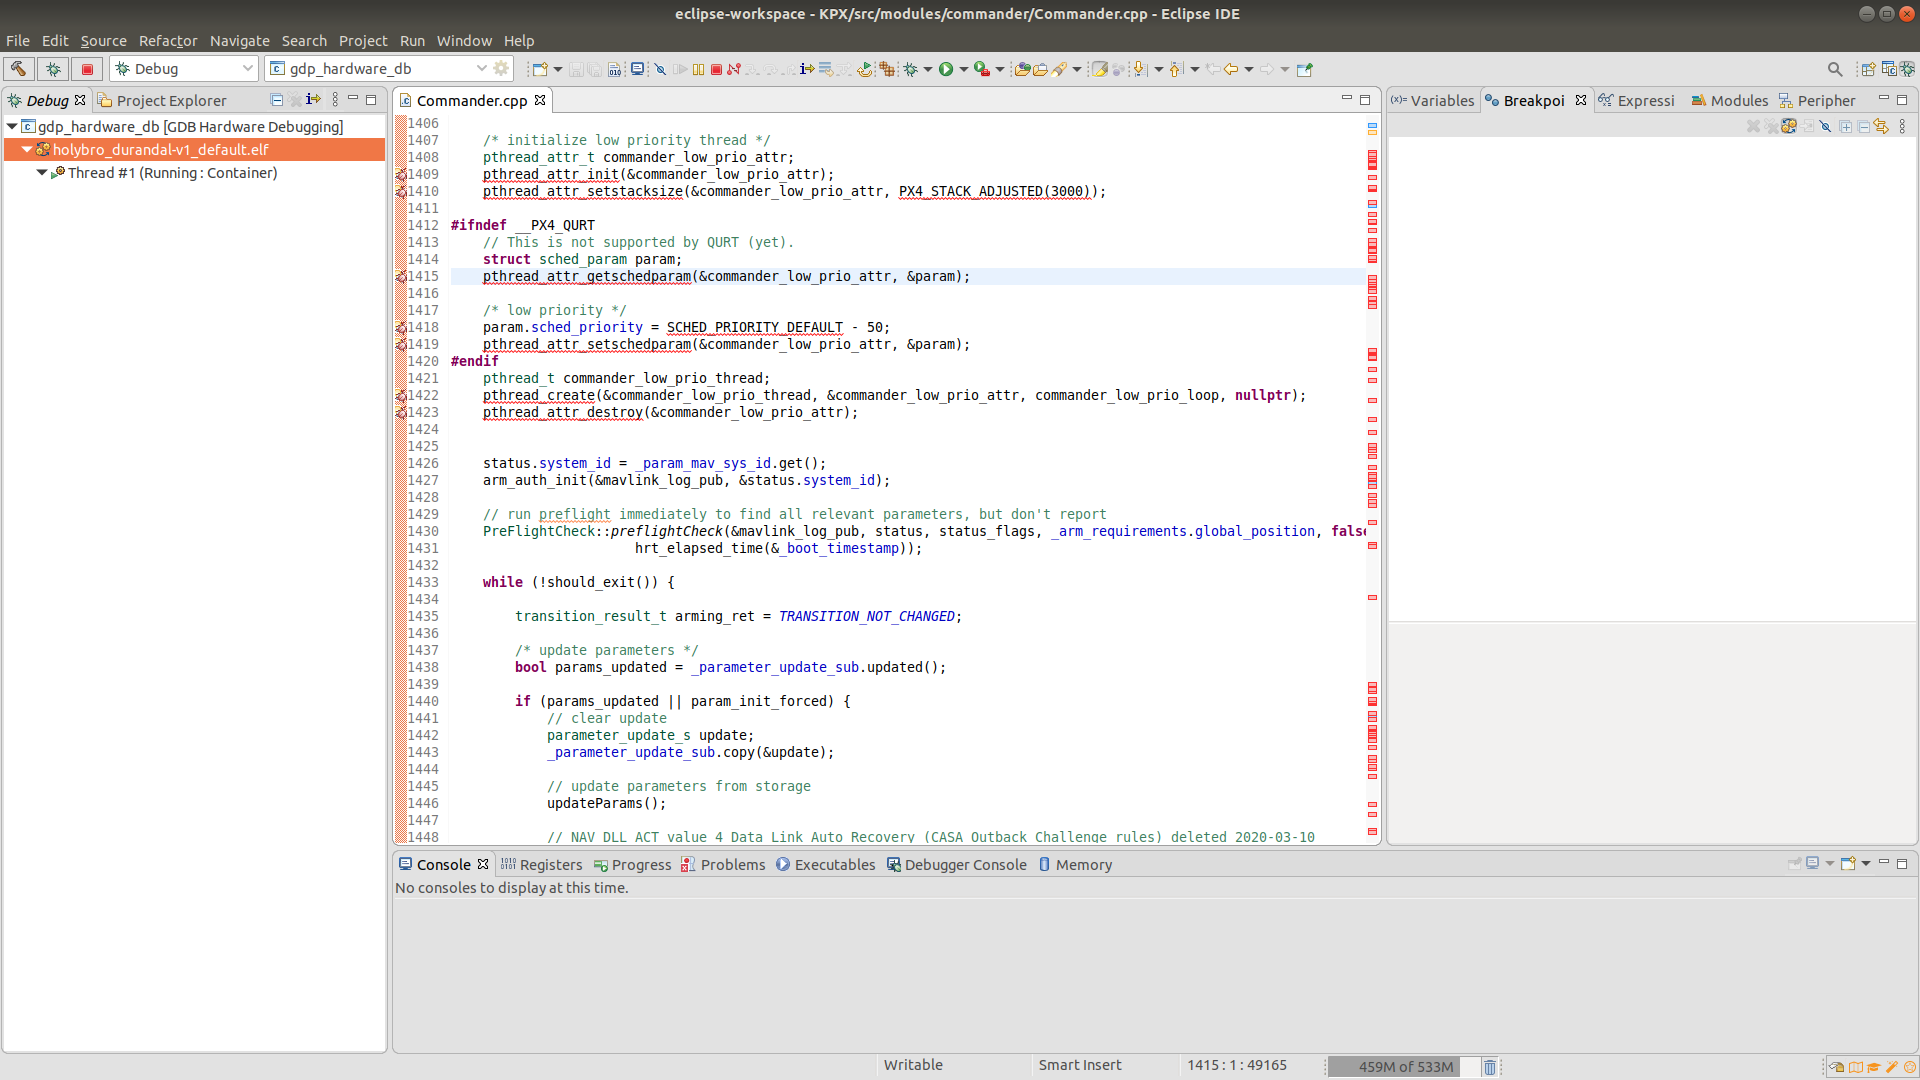
Thanks @david_s5 for the fast answer! I have tried to find this option but couldn’t. The debug tab is the one on the left with the debugger shown it if I know correctly, but I cannot see option like this there. I also tried in the configuration of the debugger and the properties of the breakpoints.
I guess I missed something obvious, but can you give some detail how (in which menu) can I find it? For reference I upload here the screenshot of what I see in Eclipse (currently there is no breakpoint set).
Thanks a lot.
Sorry…there are a lot of settings in eclipse.
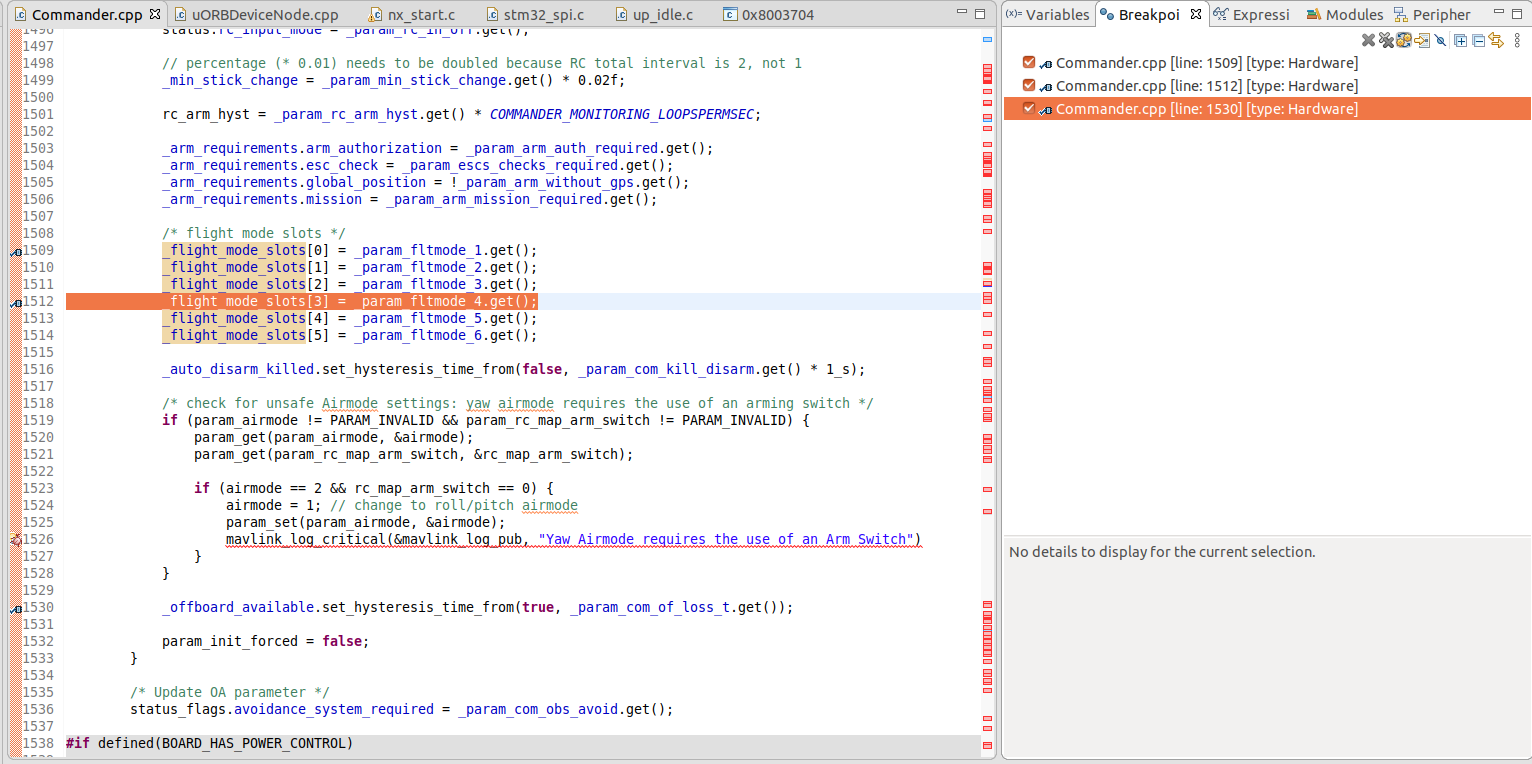
Thanks, I could find it now (I just started using Eclipse for this debugging purpose, so I am a beginner in handling it.). That actually helped, but it is still behaving strangely. On the second image you can see the breakpoints set, the debugger stops at the first, then I can step over to the second, but when I step over again it goes to and stops at line 1516. After that the program just start to run (with step over and step in, too) and does not stop at the third breakpoint.
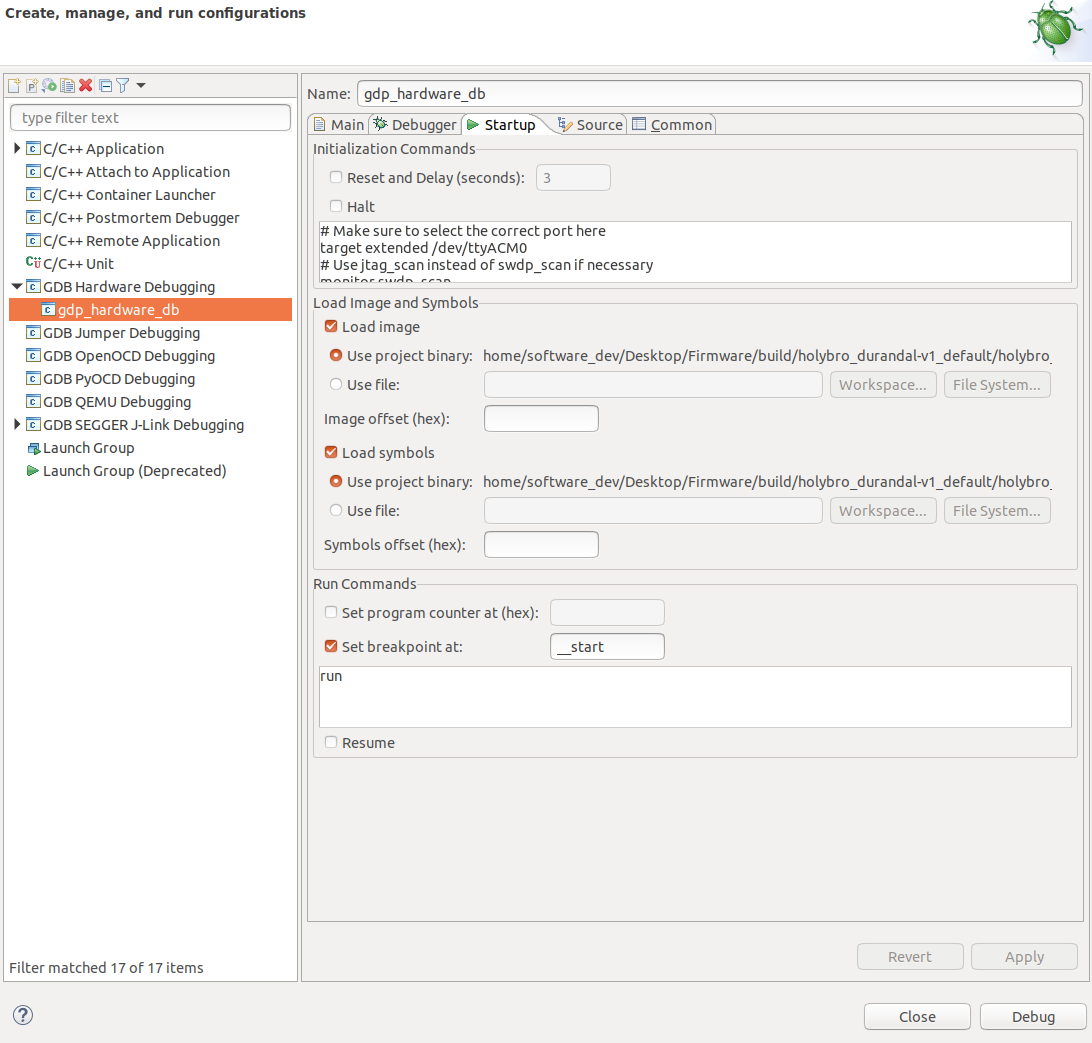
I tried choosing “Resume”, and delete “run” command in the configurator, but it didn’t help.
I only use a segger jlink. Are you using a Jlink? Perhaps you need to configure it as such?
I am using Dronecode probe, that has some tutorial here, that is stating to choose the “GDB Hardware Debugging” configuration.