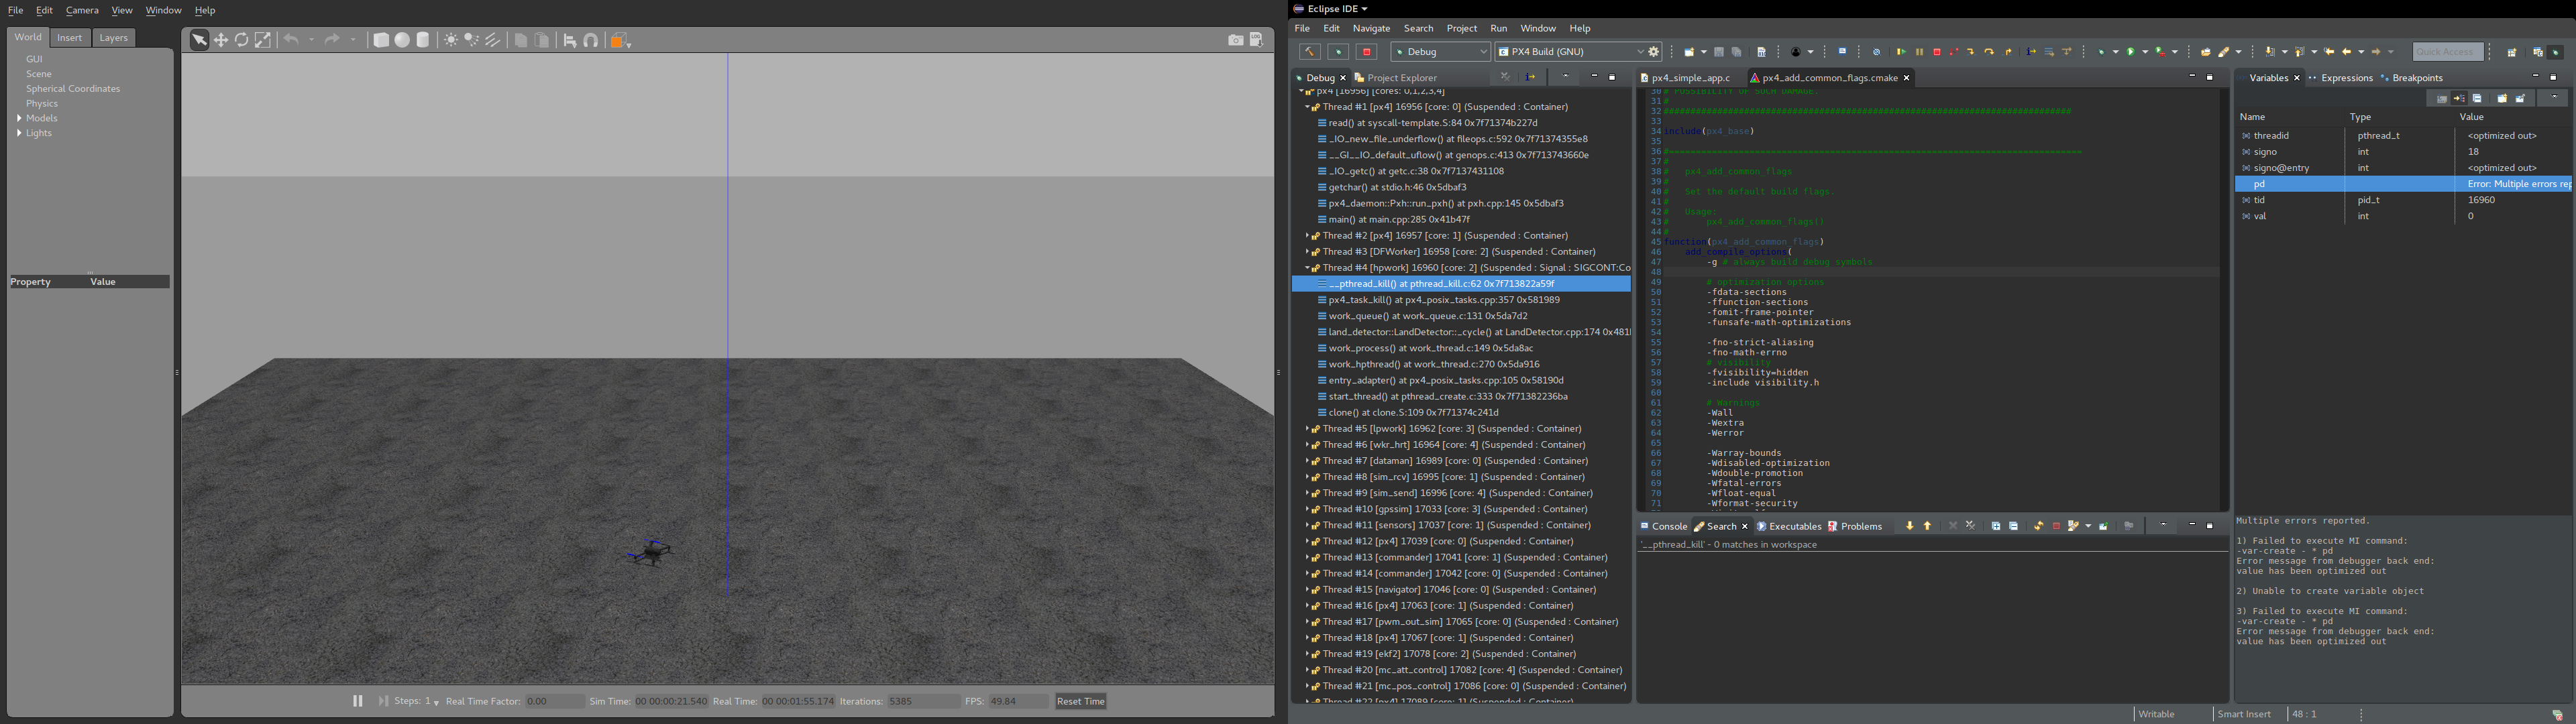
I’ve been trying to use Eclipse to debug in SITL using attach mode. When i press continue/resume it just pauses and i think it has something to do with the optimized error. Use an IDE to debug px4 modules had the exact same issue as I do. I’ve tried to run with the compiler optimization off however i wasn’t able to get it to work.
Can you give me the instructions you used to debug via Eclipse?
It has been a while since I did this but I believe I ran the SITL application for PX4 in debug mode and then used the eclipse attach to process feature. This (https://dev.px4.io/v1.9.0/en/debug/simulation_debugging.html) section actually describes how to solve my issue I had with variables being optimized out.
Ok, so i got it to work, thanks, this is what i did in case someone stumbles upon this:
In eclipse: configuration attach to application configuration, set px4 application, disable auto build, set gdb command file to /home/ros/.gdbinit
in ~/.gdbinit
add-auto-load-safe-path /home/ros/Firmware/build/px4_sitl_default/tmp/rootfs/.gdbinit
-
$ make px4_sitl_default gazebo
-
Attach in eclipse with debug, select px4
Important: allow ptraching of non-child processes (permission denied error to attach via ptrace)
echo 0 | sudo tee /proc/sys/kernel/yama/ptrace_scope
To permanently allow it edit /etc/sysctl.d/10-ptrace.conf and change the line:
kernel.yama.ptrace_scope = 1
To read
kernel.yama.ptrace_scope = 0
1 Like